
(Mike Maharrey, Money Metals Exchange) Gold’s long-term return is greater than conventional wisdom might lead you to believe.
Traditional analysis of gold’s returns leaves out important factors. Models considering these elements reveal much better returns over time that far outpace the inflation rate.
Gold is typically viewed as a store of value. Over time, investors expect its price to keep pace with inflation. Using traditional models, we find gold’s returns are tightly correlated with the general price level as measured by the consumer price index (CPI).
Using this assumption, the long-term expected return for gold generally ranges between zero and 1 percent.
However, analysis by the World Gold Council concluded that there are two common features in existing research and forecast models that “mischaracterize gold and have led to biased conclusions.”
First, nearly all models use data from periods with a gold standard. Second, existing models tend to tend to view long-term price dynamics almost exclusively through the lens of demand from financial markets while ignoring other sources of demand.
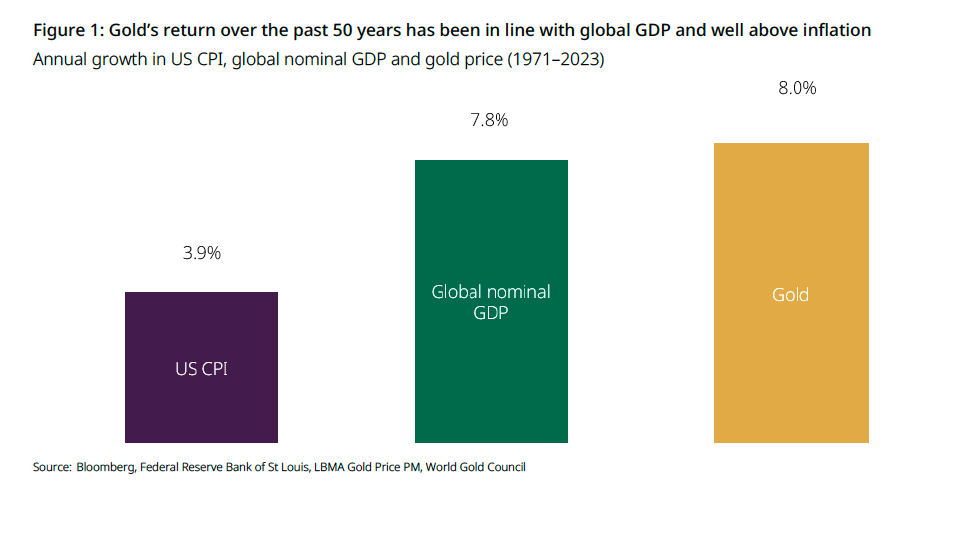
Utilizing an approach that accounts for these two factors, the World Gold Council shows that gold’s long-run real return has been well above inflation for over 50 years and that it tends to mirror global GDP.
Using the World Gold Council formula, we find that between 1971 and 2023, gold’s annual return has been around 8 percent.
The Gold Standard Problem
One of the problems in analyzing and projecting long-term gold returns is using data from the gold standard era. As the World Gold Council points out, typically, more historical data is better than less. Capital market assumptions used in analyzing stocks and bonds typically stretch back to 1900.
But when analyzing gold prices, the longer timeline skews the data because, for most of the 20th century, the price of gold was set by central banks. Up until President Richard Nixon closed the Gold Window in 1971, the conversion rate for gold was $35 per ounce, as set by the Bretton Woods Agreement.
As the World Gold Council pointed out, “While its historical performance during Gold Standard periods is an interesting reference, it is truly its market structure and behavior post-1971 that matters most.”
“By way of an example, to value a company and assess its expected return, one needs to apply the analysis to the business it will be rather than to the business it has been. If the two are materially different, then past is not prologue.”
To avoid the gold standard muddying the water, the World Gold Council uses 1971 as a starting date instead of earlier dates used by most other analyses.
Investment Bias
The second issue that tends to muddy the analysis of the long-term performance of gold is that models generally assume financial investment almost exclusively drives demand, ignoring other important demand factors.
Of course, financial investment is one of the primary short-term price drivers, but the World Gold Council asserts that other sources of buying are more significant over the long term.
The WGC illustrated this by creating a gold “cube” representing the existing above-ground stock of gold, noting that it would occupy a space barely larger than three Olympic swimming pools.
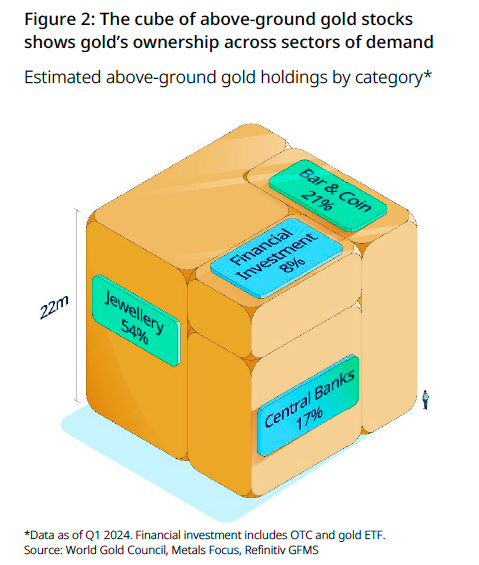
As you can see, financial investment makes up a relatively small percentage of demand in relation to existing gold stocks.
“It reveals how little financial investment – (referring here to physically backed gold ETFs and over-the-counter [OTC] physical holdings) has been amassed by market participants over the years in relation to other sources of demand – a misleading statistic given the vast volumes of gold that flow through financial centers every day. That so much of this hypothetical cube is not owned via financial instruments implies that any explanation of its total distribution must consider factors beyond those solely linked to the day-to-day decisions of financial market participants.”
A Better Model to Project Gold Returns
Ultimately, two distinct components drive the gold the gold price.
- An economic component
- A financial component
Traditional analysts overstate the financial component.
To correct this bias, the World Gold Council created a model that proxies both the economic and financial components driving the gold price.
“Our economic component proxy is global nominal GDP in US dollars. Nominal GDP comprises real GDP, an inflation component (the GDP deflator), and a currency component – used to convert local GDP to US dollars. This captures the flow of capital from income to gold. Our financial component is proxied using the capitalization of global equity and bond markets – the global portfolio – in US dollars. It captures the investments available for investors to reallocate income and wealth.”
Using these assumptions, the number crunchers at the World Gold Council created a mathematical formula. It’s a bit complex for the scope of this article, but if you want to dig into the details, you can read the entire WGC report.
The bottom line is that using this revised model, the World Gold Council finds gold’s returns have been much better over the last 50 years than mainstream analysis suggests – averaging 8 percent annually.
The same model predicts an annual average return of 5.2 percent for the next 15 years.
“This is lower than the historical return we’ve observed, largely down to a lower expected growth in global GDP. However, all asset returns are likely to be impacted. For example, estimates for intermediate U.S. Treasury bonds and World government bonds over the same period are 3.9 percent and 4.8 percent, respectively. And U.S. large-cap stocks are expected to grow at a 7 percent annual rate – below their 20-year return.”
The World Gold Council concludes, “In our view, any model that fails to account for economic growth alongside financial factors will prove insufficient in establishing gold’s long-term expected return.”
Of course, past performance does not guarantee future results. Dynamics could change. And this isn’t to say that if global GDP tanks, gold’s returns will as well. In an economic meltdown, the investment aspect of gold demand would likely become a bigger driver. But this kind of historical analysis does provide a good framework to help understand gold’s performance over time. And it reveals that gold’s real returns are better than the mainstream would have you believe.
Mike Maharrey is a journalist and market analyst for MoneyMetals.com with over a decade of experience in precious metals. He holds a BS in accounting from the University of Kentucky and a BA in journalism from the University of South Florida.
. Using this assumption, the long-term expected return for gold generally ranges between zero and 1 percent. )