
(Jesse Colombo, Money Metals News Service) The U.S. Dollar Index is at a critical inflection point, and how it behaves from here will have a major impact on the direction of gold, silver, and commodities.
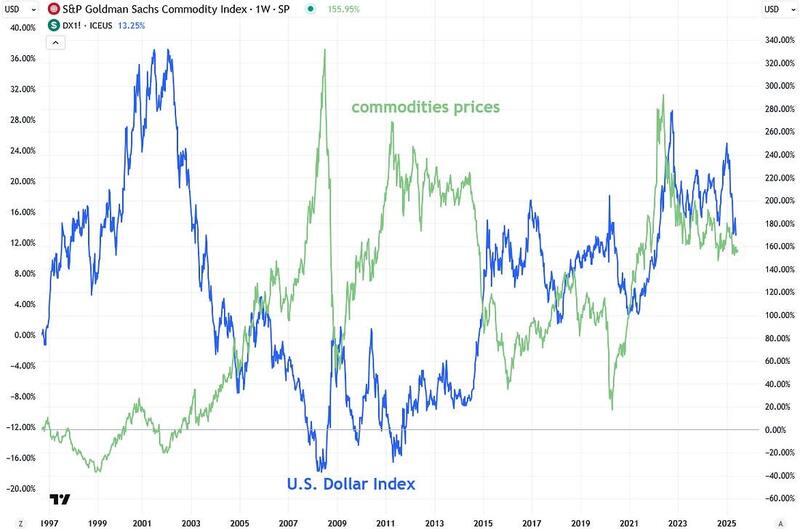
As a quick reminder, the U.S. dollar typically trades inversely with commodities—when the dollar rises, commodity prices often fall, and vice versa. This is where intermarket analysis comes into play—a method of examining related markets to gain insights and anticipate moves across asset classes.
As a reminder, I track the dollar via the U.S. Dollar Index—a measure of the dollar’s exchange rate against a basket of major world currencies (not its purchasing power).
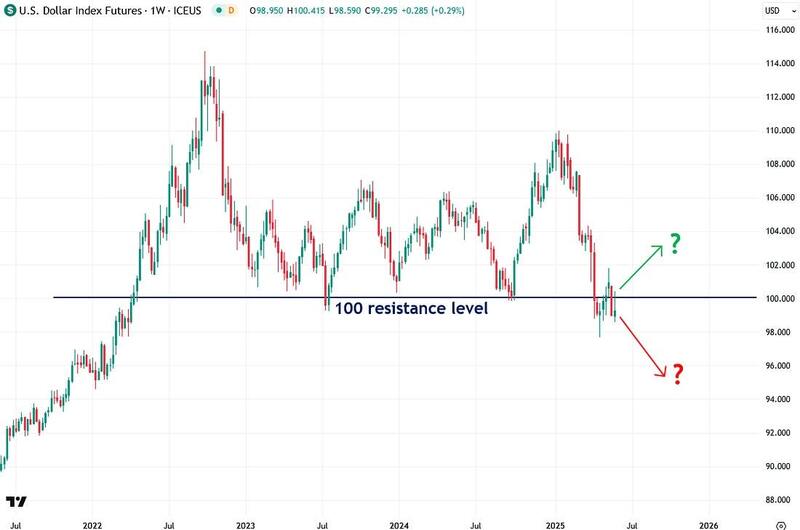
I’ve been highlighting how the U.S. Dollar Index has been teetering on the critical 100 level—a key technical support that dates back to 2023. Since then, several major dollar rallies have originated from this level, often exerting downward pressure on commodity prices—including gold and silver.
However, it’s noteworthy that the index has now broken below this key threshold, signaling an important shift in trend. If the dollar remains below 100, it would strongly indicate that further weakness lies ahead—an important bullish development for gold, silver, and the broader commodities complex.
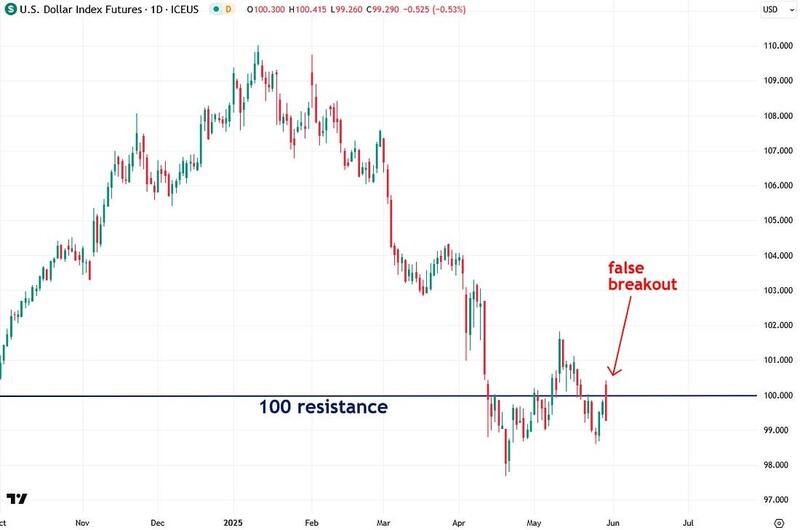
Zooming in on the daily Dollar Index chart, it’s important to note that the index hasn’t cleanly broken down yet. Instead, it has been chopping back and forth around the key 100 level, creating a series of false moves and overall choppy, indecisive price action. However, I believe that once the dollar commits to a direction, the resulting move will be significant.
As of yesterday, the dollar is trading sharply lower—giving a lift to gold and silver—after a hit to market confidence stemming from a U.S. Court of International Trade ruling on Wednesday night. The court found that President Trump exceeded his authority in imposing “reciprocal” tariffs and ordered those measures to be vacated.
Adding to the pressure, Moody’s recent downgrade of U.S. debt has further eroded confidence in the dollar, contributing to its ongoing weakness.
As a result of yesterday’s decline, the U.S. Dollar Index has once again slipped below the 100 level, signaling that another attempt to reclaim that key threshold has failed—a clear sign of weakness. If the index can finally remain below 100, there’s a strong chance it will continue to slide toward multi-year lows—a scenario that would be a major tailwind for precious metals investors. This is a critical development worth watching closely.
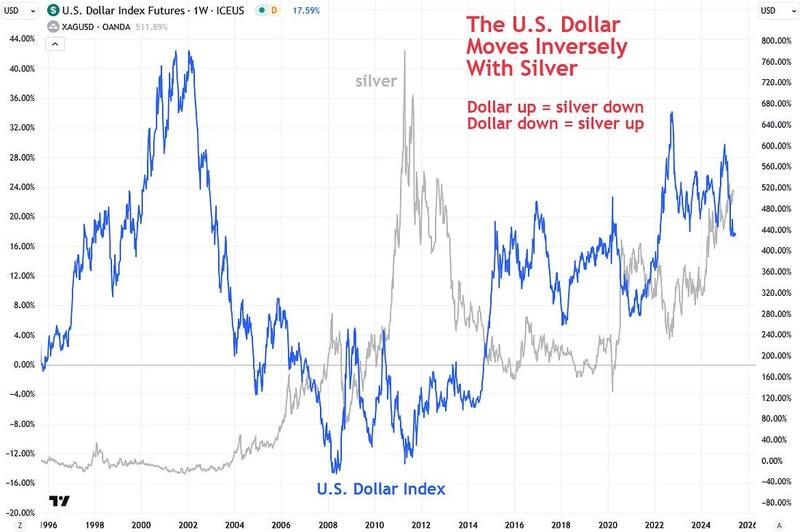
Although I’ve emphasized the longstanding inverse relationship between the U.S. dollar and commodities, it’s especially helpful to see that correlation visually:
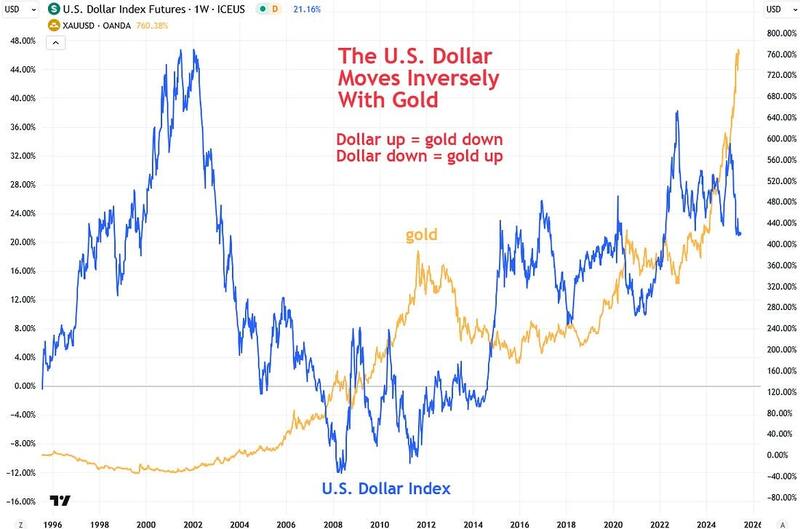
You can also clearly see the inverse relationship between the U.S. dollar and gold:
And here is the inverse relationship between the U.S. dollar and silver:
Gold has been taking a healthy pause, trading in a consolidation range between $3,200 and $3,500 over the past month.
If the U.S. Dollar Index finally holds below the critical 100 level, it should provide the fuel gold needs to break out of that range and resume its upward trajectory—likely targeting the $4,000 level next. That’s a major technical and psychological milestone, and such round numbers often act like price magnets.
This is an exciting setup worth keeping a close eye on.
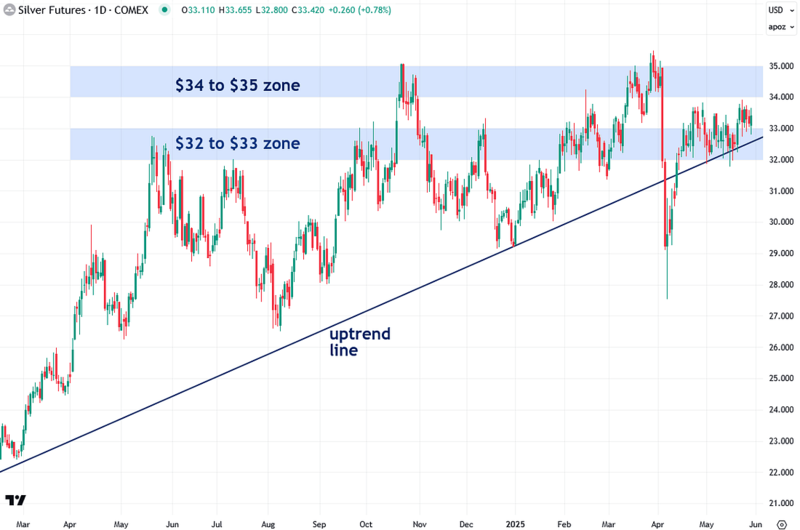
Similarly, silver has spent the past year trading beneath two major resistance zones—$32–$33 and $34–$35—even as gold has surged ahead, much to the frustration of silver bulls. However, there are numerous compelling reasons to remain bullish on silver.
If the U.S. Dollar Index continues to weaken, it may be the catalyst silver needs to finally break through those resistance levels. Once that breakout occurs, I believe silver will accelerate quickly toward $40, $50, $60, and ultimately much higher.
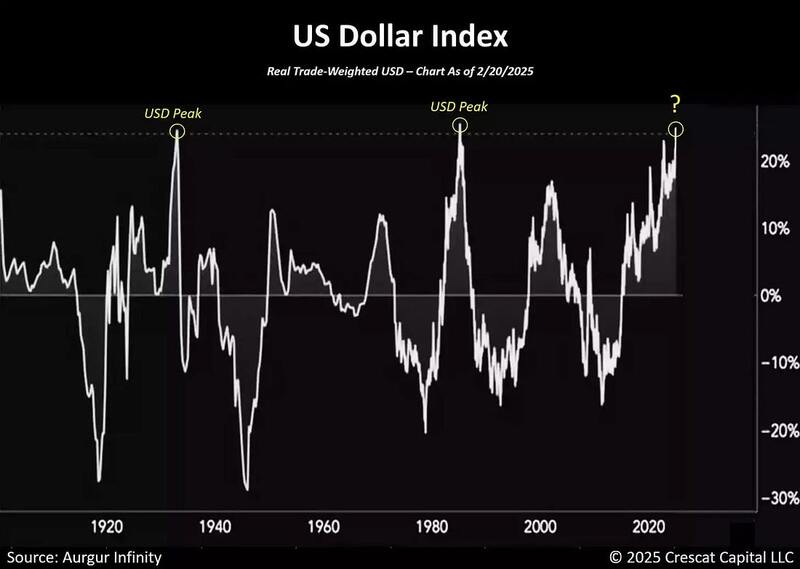
It’s important to recognize the high probability of a coming U.S. dollar bear market, largely due to how historically overvalued the dollar has become relative to other major currencies.
In fact, based on over 120 years of data, such extreme overvaluation has only occurred twice before—in 1933 and 1985—both of which were followed by substantial dollar declines.
The dollar’s unusual strength in recent years has been a major factor keeping commodity prices much lower than they would ordinarily be. However, an impending correction in the dollar’s value should trigger a powerful bullish surge across the commodities sector, including assets like copper, gold, silver, and mining stocks.
One of the key reasons the U.S. dollar remains so strong relative to other currencies is the massive—and unsustainable—bubble in U.S. equities, particularly in tech stocks like Nvidia and Microsoft. This has attracted a surge of foreign capital into U.S. markets, driving demand for dollars and pushing the currency much higher.
Interestingly, we saw a similar dynamic during the late 1990s dot-com bubble. When that bubble eventually burst, the dollar weakened significantly, helping to ignite the early 2000s commodities supercycle. I believe we’re on the verge of a similar pattern playing out once today’s stock market bubble finally unravels in a major way.
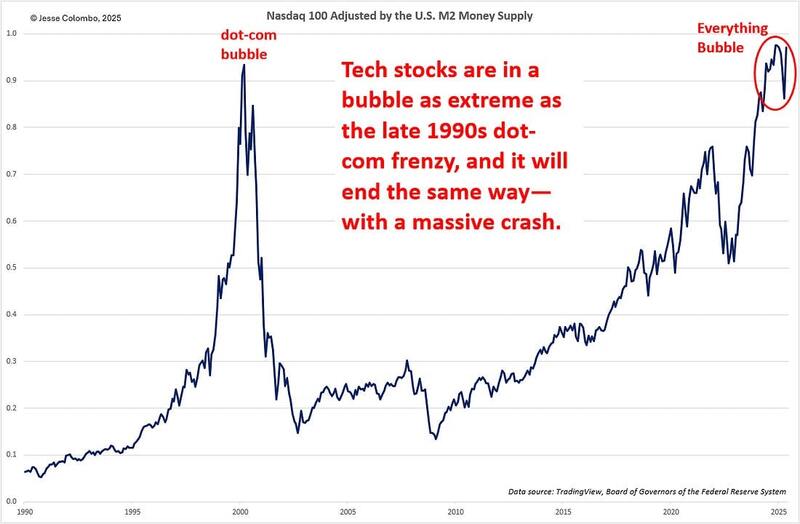
Numerous valuation metrics confirm that U.S. stocks—especially tech—are deep in bubble territory.
One striking example is the Nasdaq 100 relative to the U.S. M2 money supply, which shows that tech stocks have become severely overextended. The chart reveals clear parallels to the dot-com bubble, and unfortunately, I believe the outcome will be the same.
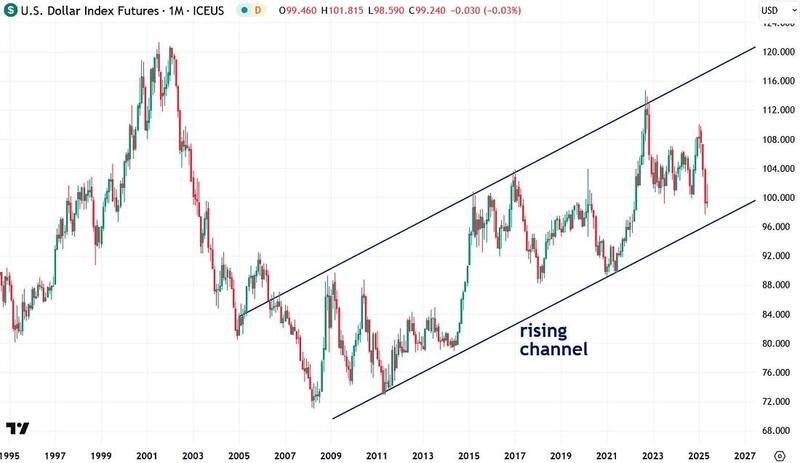
A look at the long-term U.S. Dollar Index chart reveals that it has been trading within a rising channel since around 2008. I believe an eventual breakdown from this channel would be a key signal that the dollar is entering a new bear market—much like the one that occurred in the early 2000s.
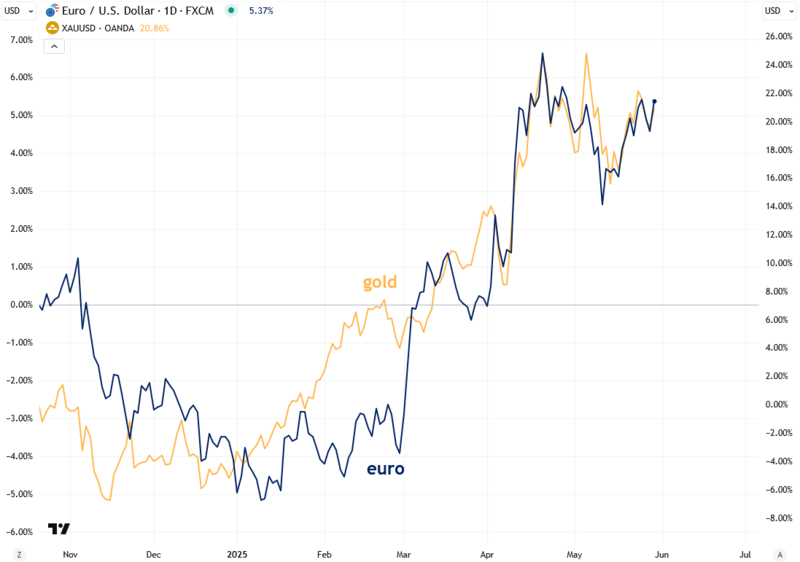
As the chart below illustrates, the euro and gold have been moving in close lockstep in recent months. If this nascent euro breakout gains traction, it should serve as a powerful catalyst for gold—potentially propelling it to $4,000 and beyond.
I believe this gold bull market is still in its early stages, with the potential to reach at least $15,000 an ounce over the next 5 to 10 years.
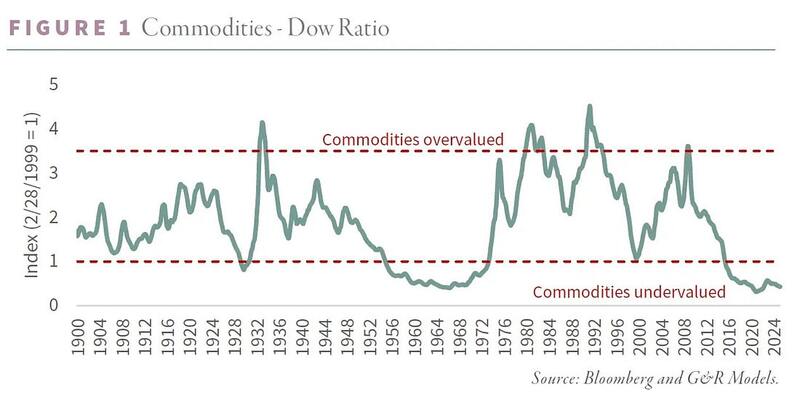
I previously mentioned the early-2000s commodities supercycle and why I believe another one is on the horizon—driven in large part by the U.S. dollar’s extreme overvaluation, which I expect will lead to a prolonged bear market. There’s further confirmation of this thesis in the commodities-to-Dow ratio, which shows that commodities remain extremely undervalued relative to stocks.
Historically, such imbalances don’t last; they tend to normalize over time—likely through a powerful commodities boom and a significant correction in equity markets. This aligns with my broader view that we’re in the early stages of a major capital rotation out of overvalued stocks and into still-undervalued gold and silver.
I hope you found this analysis helpful. It also serves as a great example of intermarket analysis—a method I strongly believe in and rely on heavily, both in this newsletter and in my own investing. Intermarket analysis involves examining one asset, such as the U.S. dollar, to gain insights into how correlated assets—whether positively or negatively correlated, like commodities or the euro—are likely to behave. This approach often reveals key market signals and turning points that might be missed when analyzing assets in isolation.
Intermarket analysis is a lesser-known but incredibly powerful technique. If you’d like to dive deeper into it, I highly recommend Intermarket Analysis by John Murphy—it’s one of my all-time favorite market books and an essential read for anyone serious about understanding cross-market relationships. Trust me, you won’t be disappointed.
Another book worth exploring is Intermarket Analysis and Investing by Michael E.S. Gayed, which I’ve heard great things about and recently picked up myself.
To sum up, the U.S. Dollar Index is at a critical inflection point as it hovers around the key 100 technical level. How it behaves from here will have a major impact on the direction of gold, silver, and other commodities.
My longer-term bias remains firmly to the downside, given how historically overvalued the dollar is—indicating that the path of least resistance is lower. If that scenario plays out, I expect a powerful commodities boom, with gold surging to $4,000 and silver climbing to $50+. I’ll be monitoring this closely and will keep you updated as it unfolds.
If you found this report valuable, click here to subscribe to The Bubble Bubble Report for more content like it.
Jesse Colombo is a financial analyst and investor writing on macro-economics and precious metals markets. Recognized by The Times of London, he has built a reputation for warning about economic bubbles and future financial crises. An advocate for free markets and sound money, Colombo was also named one of LinkedIn’s Top Voices in Economy & Finance. His Substack can be accessed here.