")
(Jesse Colombo, Money Metals News Service) Gold and silver are currently consolidating in a healthy manner, which is likely laying the groundwork for their next leg higher.
I’m encouraged to see them consolidating in a healthy manner, which I believe is ultimately laying the groundwork for the next leg of the bull market. Precious metals are also finding support from Moody’s recent downgrade of U.S. debt—a sharp reminder that the nation’s fiscal crisis remains far from resolved. In this environment of debt saturation, precious metals continue to stand out as reliable safe havens and powerful hedges against systemic risk.
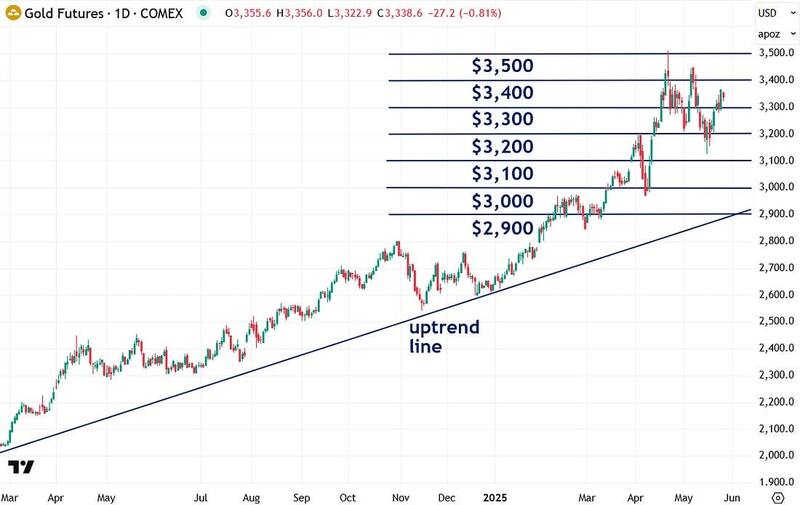
First, let’s take a look at gold in the form of COMEX futures. I’ve noticed that gold tends to move in clean $100 increments, with strong support and resistance forming around round numbers like $3,000, $3,100, $3,200, and so on.
After briefly dipping below $3,200 a couple of weeks ago, I’m encouraged to see that gold bounced back and even pushed above $3,300—an early sign of renewed strength.
At the moment, it appears to be consolidating sideways, catching its breath before the next move. The major resistance level to watch now is $3,500, which roughly aligns with the April 22nd high.
A decisive breakout above that level—especially on strong volume—would confirm that gold is ready to charge toward $4,000. That’s the scenario I’m watching for closely.
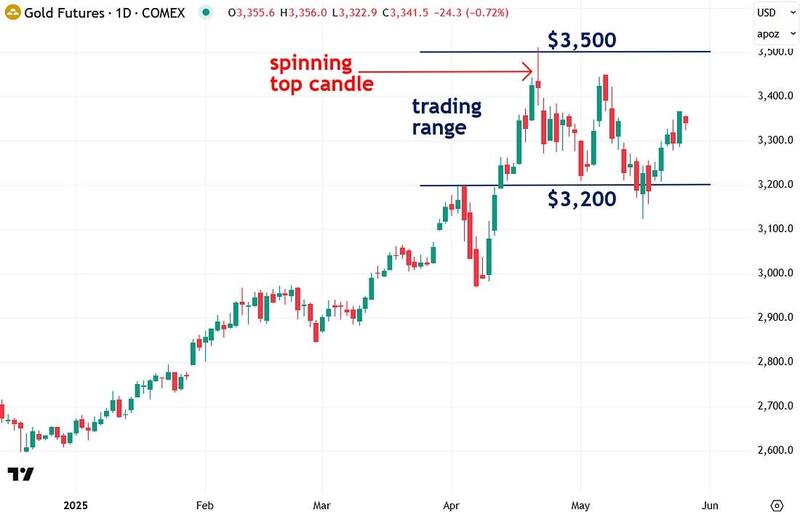
Back on April 22nd, I believed gold had likely hit a short-term peak and was due for a mild pullback—and that’s exactly what we’re seeing now. What tipped me off was the formation of a spinning top candlestick on that day, signaling indecision after a strong rally, combined with short-term overbought conditions that called for a cooling-off period.
At the moment, COMEX gold futures are trading within a $300 range between $3,200 and $3,500 as the metal digests those prior gains.
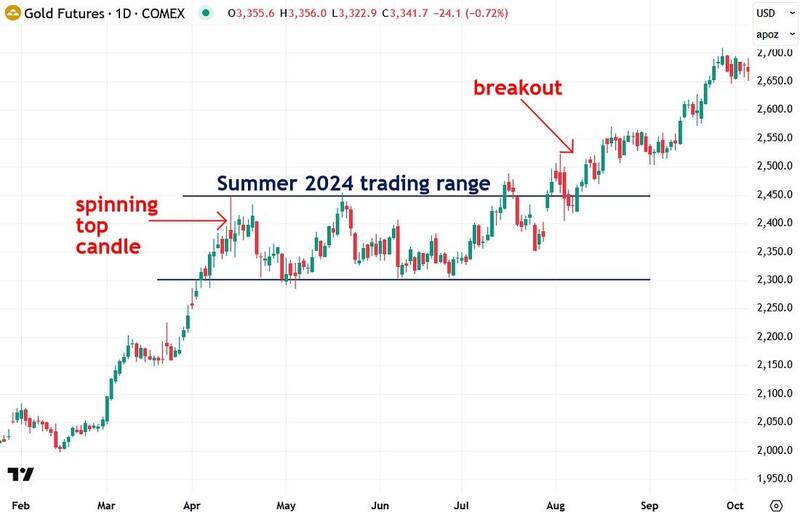
What I find particularly interesting—and encouraging—is the striking parallel between the current consolidation and what happened exactly one year ago. Back then, a spinning top candlestick also marked the peak of a powerful $400 rally during March and April, which left gold temporarily overbought. That was followed by a period of sideways consolidation, much like we’re seeing now, before gold broke out again in August 2024 and went on to post significant gains through November. It’s a compelling setup, and one worth watching closely to see if history repeats itself.
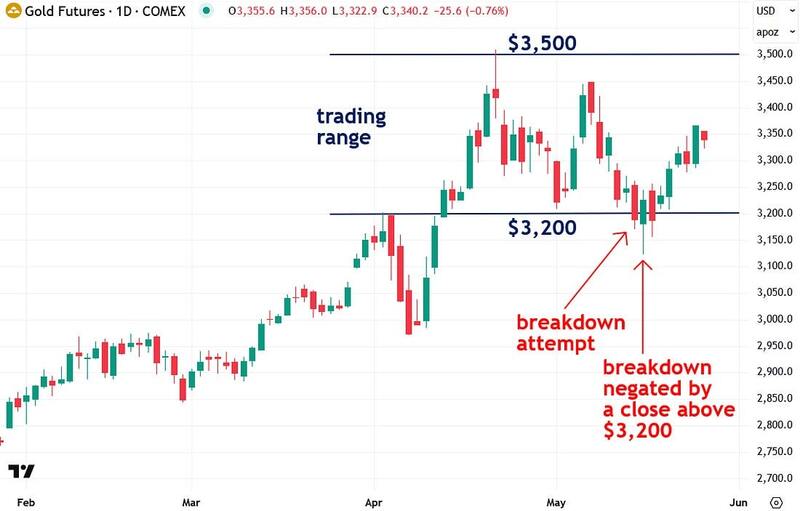
I also want to highlight how gold attempted to break below the $3,200 support level on May 15th but quickly reversed and snapped back into the trading range—a sign of underlying strength:
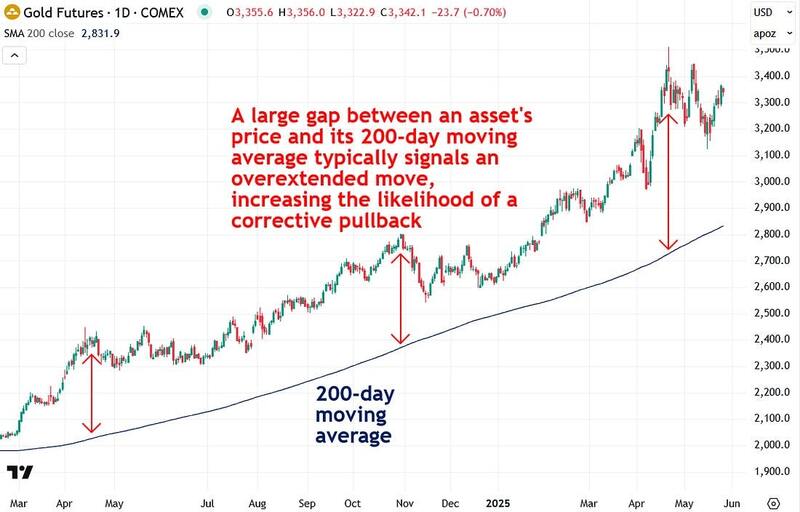
When assets like gold rally sharply, they often become overbought, making them susceptible to pullbacks or periods of consolidation to absorb the excess. A reliable way to gauge overbought conditions is by comparing the asset’s price to its 200-day moving average—a widely used indicator that smooths out short-term volatility and highlights the underlying trend.
When the price becomes significantly stretched above this moving average, it often signals vulnerability to a correction. That’s precisely what occurred in April 2024, October 2024, and again in April 2025.
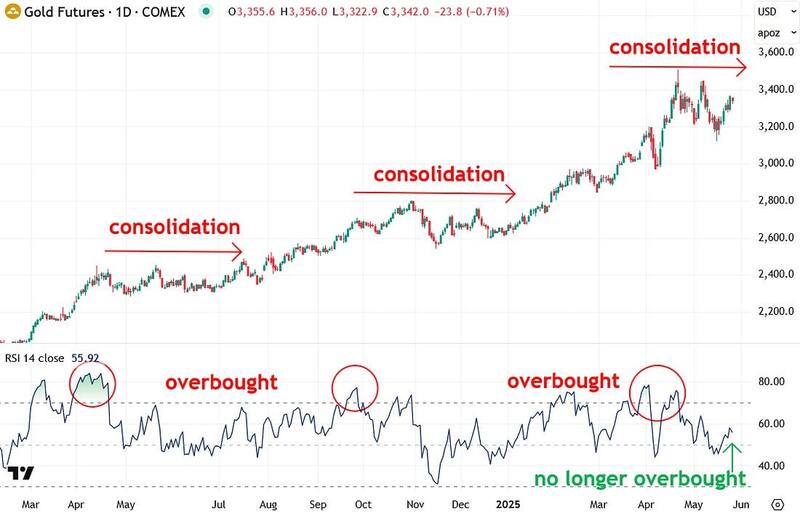
Another valuable tool I rely on is the Relative Strength Index (RSI)—a momentum oscillator that helps determine whether an asset is overbought, oversold, or in neutral territory. As the chart below illustrates, each time gold reached overbought levels on the RSI over the past year, it entered a healthy consolidation phase before resuming its upward trend. I believe that’s what’s happening now. Even more encouraging is that the RSI currently shows gold is no longer overbought, which indicates that the worst of the recent pullback is likely behind us.
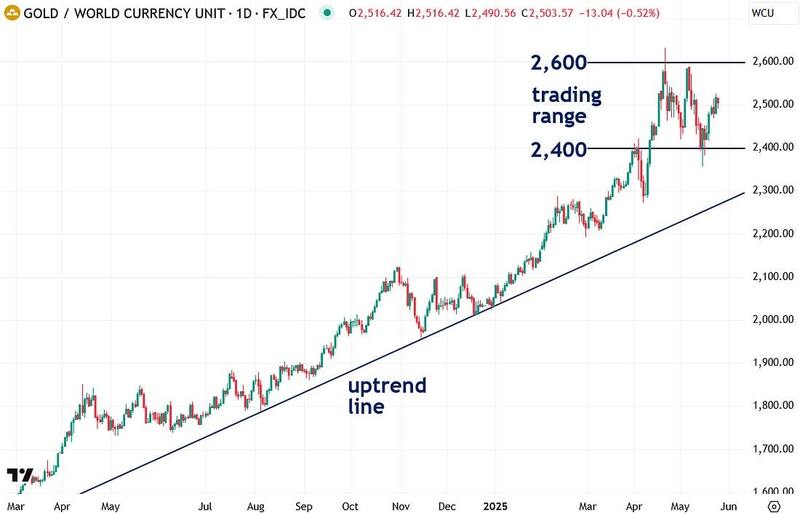
I’ve recently begun tracking gold priced in the World Currency Unit (WCU)—a composite currency based on the GDP-weighted average of the world’s 20 largest economies. In many ways, it offers one of the most balanced and accurate reflections of gold’s true global performance, which is why I’ve been paying close attention to it.
Gold priced in World Currency Units (WCUs) clearly demonstrates that its uptrend remains strong, with a well-defined trading range between 2,400 and 2,600 that’s important to watch closely:
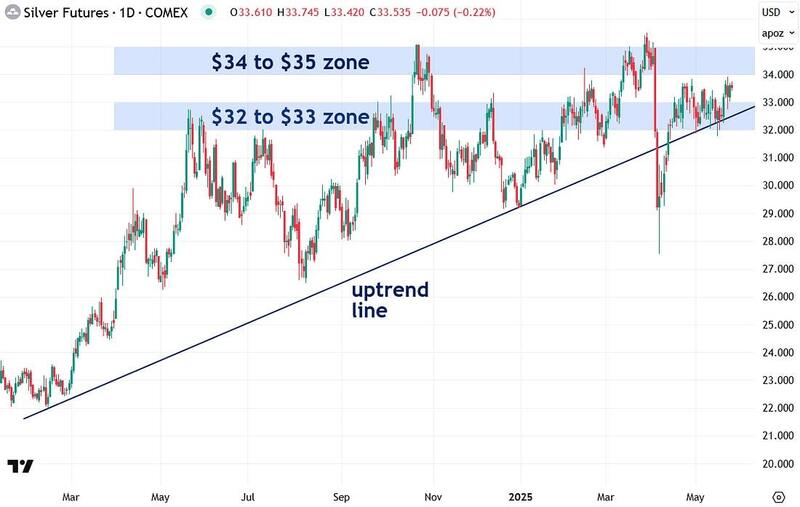
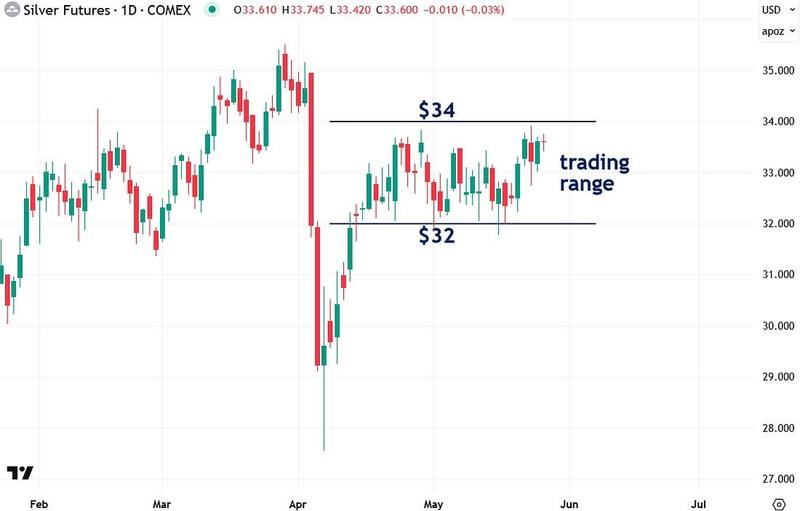
Next, let’s take a look at silver using COMEX futures, which tend to respect key $1 increments—such as $30, $31, and $32—as notable support and resistance levels. For the past year, silver has been trading sideways, capped beneath the critical $32–$33 resistance zone, followed by a secondary ceiling at $34–$35.
The good news is that silver recently broke above the $32–$33 zone—a sign of strength. The next key test is a decisive close above the $34–$35 zone, which would signal that silver is finally ready to launch into a sustained bull market, much like gold has done over the past year.
I’ve also been highlighting that silver has recently been trading within a range between $32 and $34. A bullish breakout above the $34 resistance level would be a strong confirmation that further gains are likely to follow.
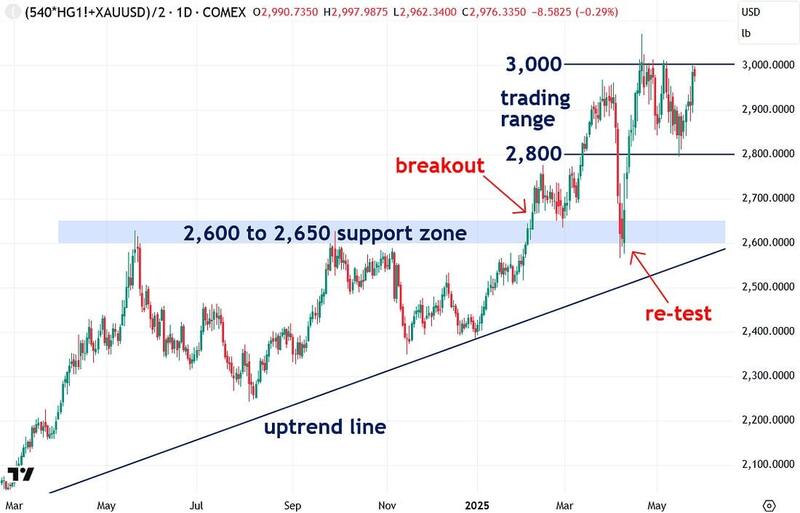
One of the key tools I’ve developed is the proprietary Synthetic Silver Price Index (SSPI)—an indicator designed to validate silver’s price action and help filter out potential fakeouts and false breakouts.
The SSPI is calculated as the average price of gold and copper, with copper adjusted by a factor of 540 to ensure gold doesn’t disproportionately impact the index. Remarkably, despite silver not being an input, the SSPI closely mirrors silver’s price movements.
Interestingly, the SSPI is currently consolidating within a range between 2,800 and 3,000. A breakout above the 3,000 resistance level would serve as a strong bullish signal for silver as well. I’ll be watching this development closely and will keep you all updated as it unfolds.
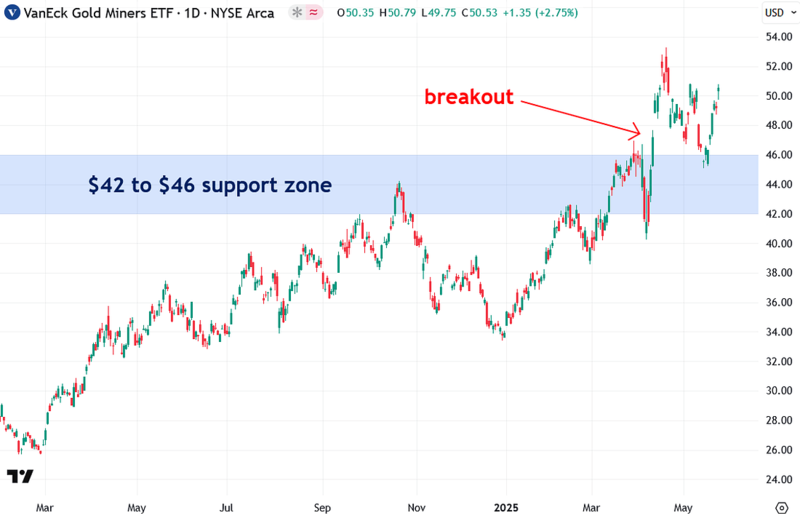
Next, let’s turn to gold mining stocks, as tracked by the popular large-cap VanEck Gold Miners ETF (GDX). Notably, GDX recently broke above the $42–$46 resistance zone I’ve been highlighting—a strong signal that gold miners are finally coming to life.
Even more encouraging, it successfully retested that zone as support and bounced, passing that technical test with flying colors. Assuming gold breaks out of its current consolidation, GDX is well-positioned to follow it higher.
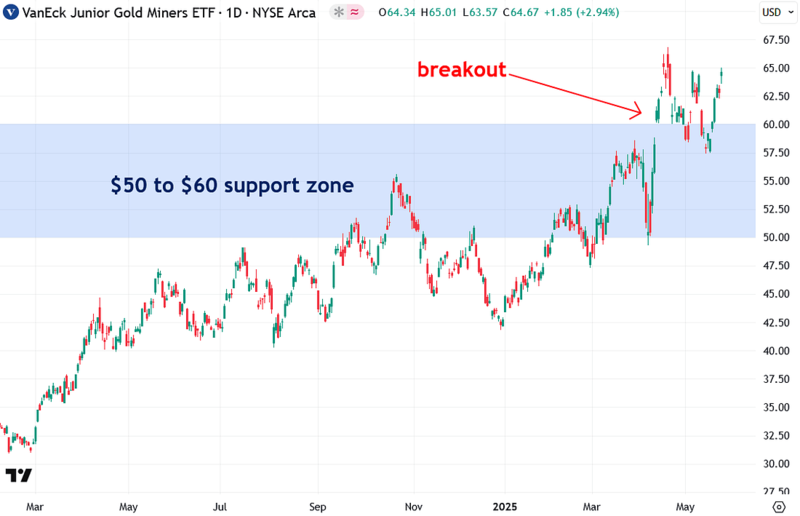
Junior gold mining stocks, as represented by the GDXJ ETF, have shown a similar pattern as GDX—breaking out above the $50–$60 zone and successfully retesting it as support. That’s a solid technical sign and further confirmation of growing strength in the mining sector.
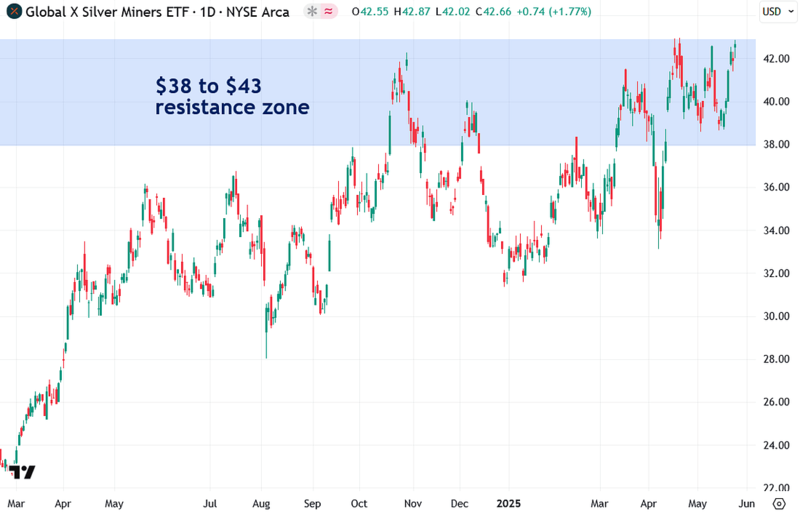
Next, let’s take a look at silver miners through the lens of the SIL ETF. It’s still trading within its $38–$43 resistance zone but is showing signs of attempting a breakout. If and when that breakout occurs—especially in tandem with a breakout in silver—I believe silver mining stocks will really shine.
These miners are essentially leveraged to the price of silver, which means their upside potential is even greater than silver itself once the silver bull market gets underway.
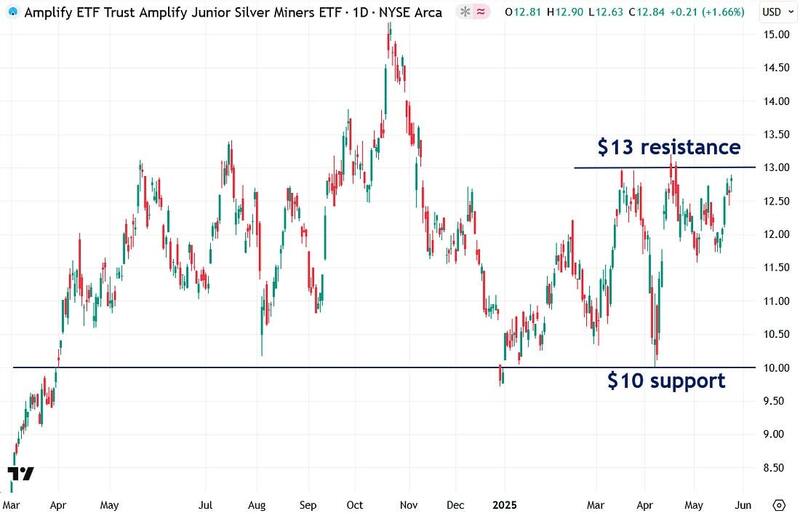
Silver junior mining stocks, as represented by the SILJ ETF, are currently trading within a range between $10 and $13. A breakout above the key $13 resistance level is the signal I’m watching for—it should mark the beginning of a strong rally or even the next major bull market phase.
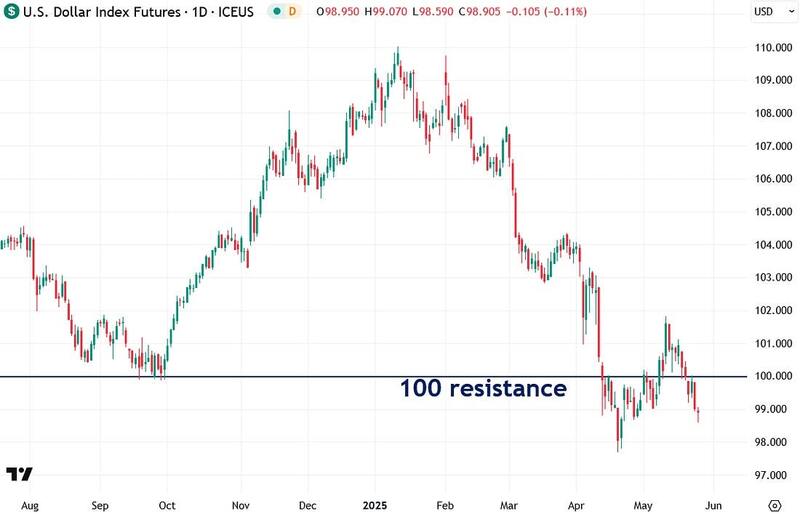
Finally, let’s take a look at the U.S. Dollar Index, which typically trades inversely with commodities like gold and silver.
The index has been hovering around the critical 100 level, producing false breakouts both above and below. Now that it’s trading back below 100, the odds favor continued dollar weakness—a potential tailwind that would help propel gold and silver out of their current trading ranges and into their next rally phases.
To summarize: although gold and silver have been relatively quiet lately, don’t mistake that for weakness. The reliable indicators I track show they’re simply consolidating and gathering strength for another potential move higher.
That said, confirmation will come only with the breakouts I outlined in this analysis. It’s also worth noting that gold may be consolidating for a similar length of time as it did last summer, given the parallels I’ve highlighted.
If you found this report valuable, click here to subscribe to The Bubble Bubble Report for more content like it.
Jesse Colombo is a financial analyst and investor writing on macro-economics and precious metals markets. Recognized by The Times of London, he has built a reputation for warning about economic bubbles and future financial crises. An advocate for free markets and sound money, Colombo was also named one of LinkedIn’s Top Voices in Economy & Finance. His Substack can be accessed here.