
(Mike Maharrey, Money Metals News Service) Analysts warned that the December CPI report would be “muddy.”
It was.
But you will find what you really need to know about the current trajectory of inflation in two unrelated charts.
The CPI Data
The December data were generally in line with expectations. Core CPI was even slightly cooler than expected, injecting a bit of optimism in the marketplace.
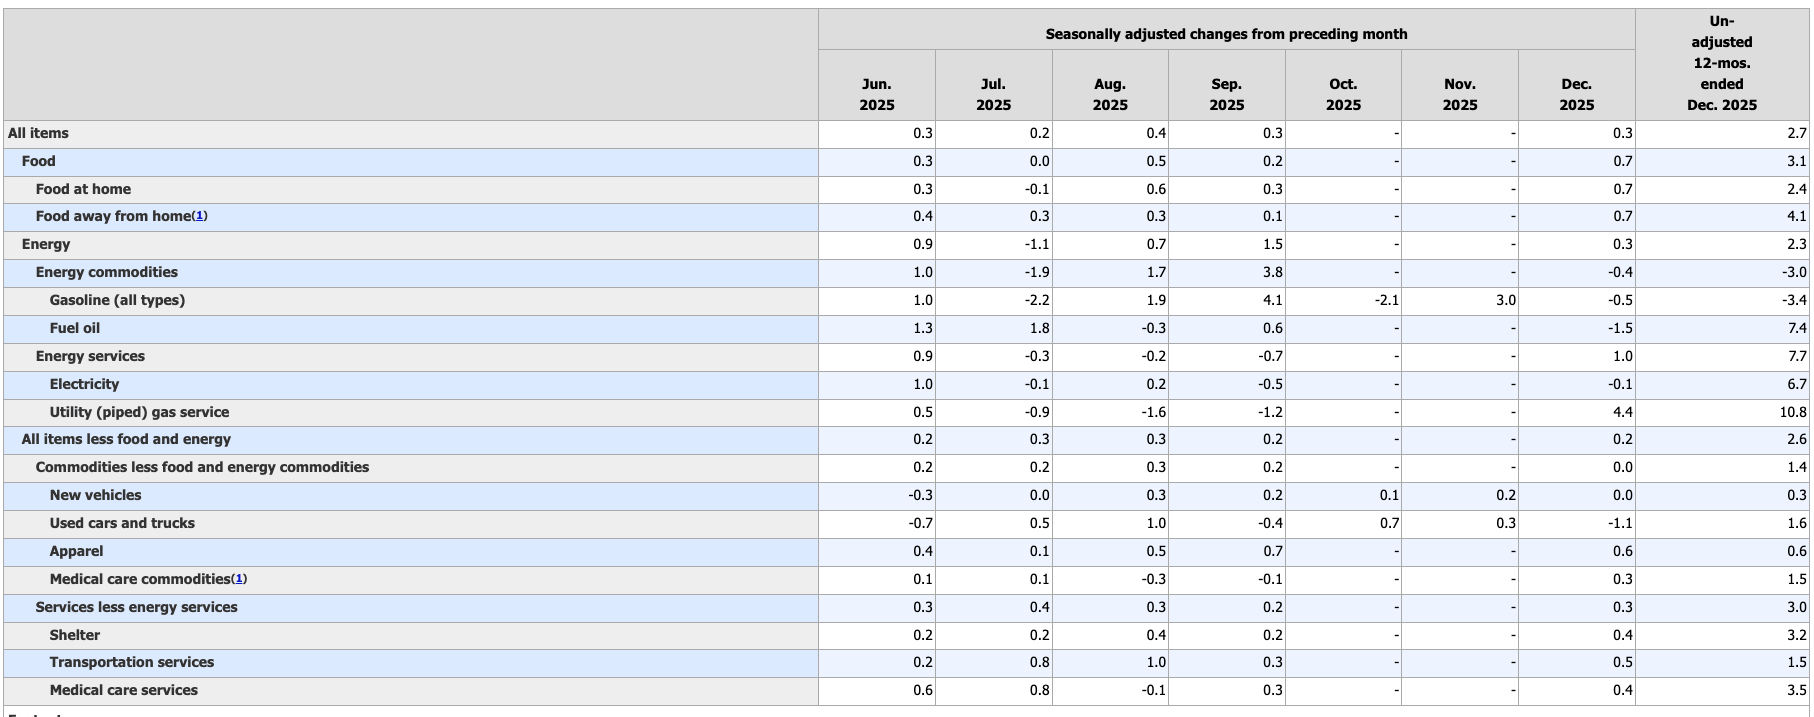
Overall, prices rose 0.3 percent month-on-month, in line with expectations. The headline annual CPI rate was unchanged at 2.7 percent, still well above the mythical 2 percent target.
Stripping out more volatile food and energy prices, core CPI prices rose 0.2 percent month on month. The annual core CPI held steady at 2.6 percent.
The core data came in slightly lower than projected, pumping some optimism that the Fed will continue its monetary easing in 2026 into the market.
However, over the last six readings (with no October data), core CPI has increased by 0.2, 0.3, 0.3, 0.2, 0.2, and 0.2 percent, annualizing to 2.8 percent. Core CPI has been mired in this range for well over a year.
Digging a little deeper into the numbers, we find shelter prices rose 0.4 percent month-on-month. Meanwhile, food prices surged by 0.7 percent in December. Energy prices also ticked up 0.3 percent, despite gasoline prices dropping by -0.4 percent.
Service costs rose by 0.3 percent, reflecting price gains mostly unconnected with tariff pressures.
Used cars and trucks charted the biggest price drop, falling 1.1 percent.
It’s important to take this CPI report with a grain of salt. It is based on a November report that they basically just made up.
Quite frankly, you should always be reluctant to read too much into these reports because they understate price inflation by design. The government revised the CPI formula in the 1990s so that it understated the actual rise in prices. Based on the formula used in the 1970s, CPI is closer to double the official numbers. So, if the BLS used the old formula, we’d be looking at CPI closer to 6 percent. And using an honest formula, it would probably be worse than that.
However, this government data drives decision-making, so we need to pay attention to what it tells us.
And the December report tells us that inflation is still well above the Fed’s stated target, despite being core readings being “cooler than expected.”
Morgan Stanley chief economic strategist Ellen Zentner put it this way.
“We’ve seen this movie before — inflation isn’t reheating, but it remains above target. There’s still only modest pass-through from tariffs, but housing affordability isn’t thawing. Today’s inflation report doesn’t give the Fed what it needs to cut interest rates later this month.”
The Real Inflation Story
The CPI tracks the changes in the price of a pre-determined “basket of goods.” This provides some insight into general price movements in the economy. But it doesn’t really tell us about “inflation” – at least in the sense economists used to define the word.
Technically speaking, inflation is an increase in the supply of money and credit. Rising consumer prices (measured by the CPI) are just one symptom of this monetary inflation. In other words, the CPI report is kind of like a thermometer. It can tell you if you have a fever, but it can’t tell you what’s causing it.
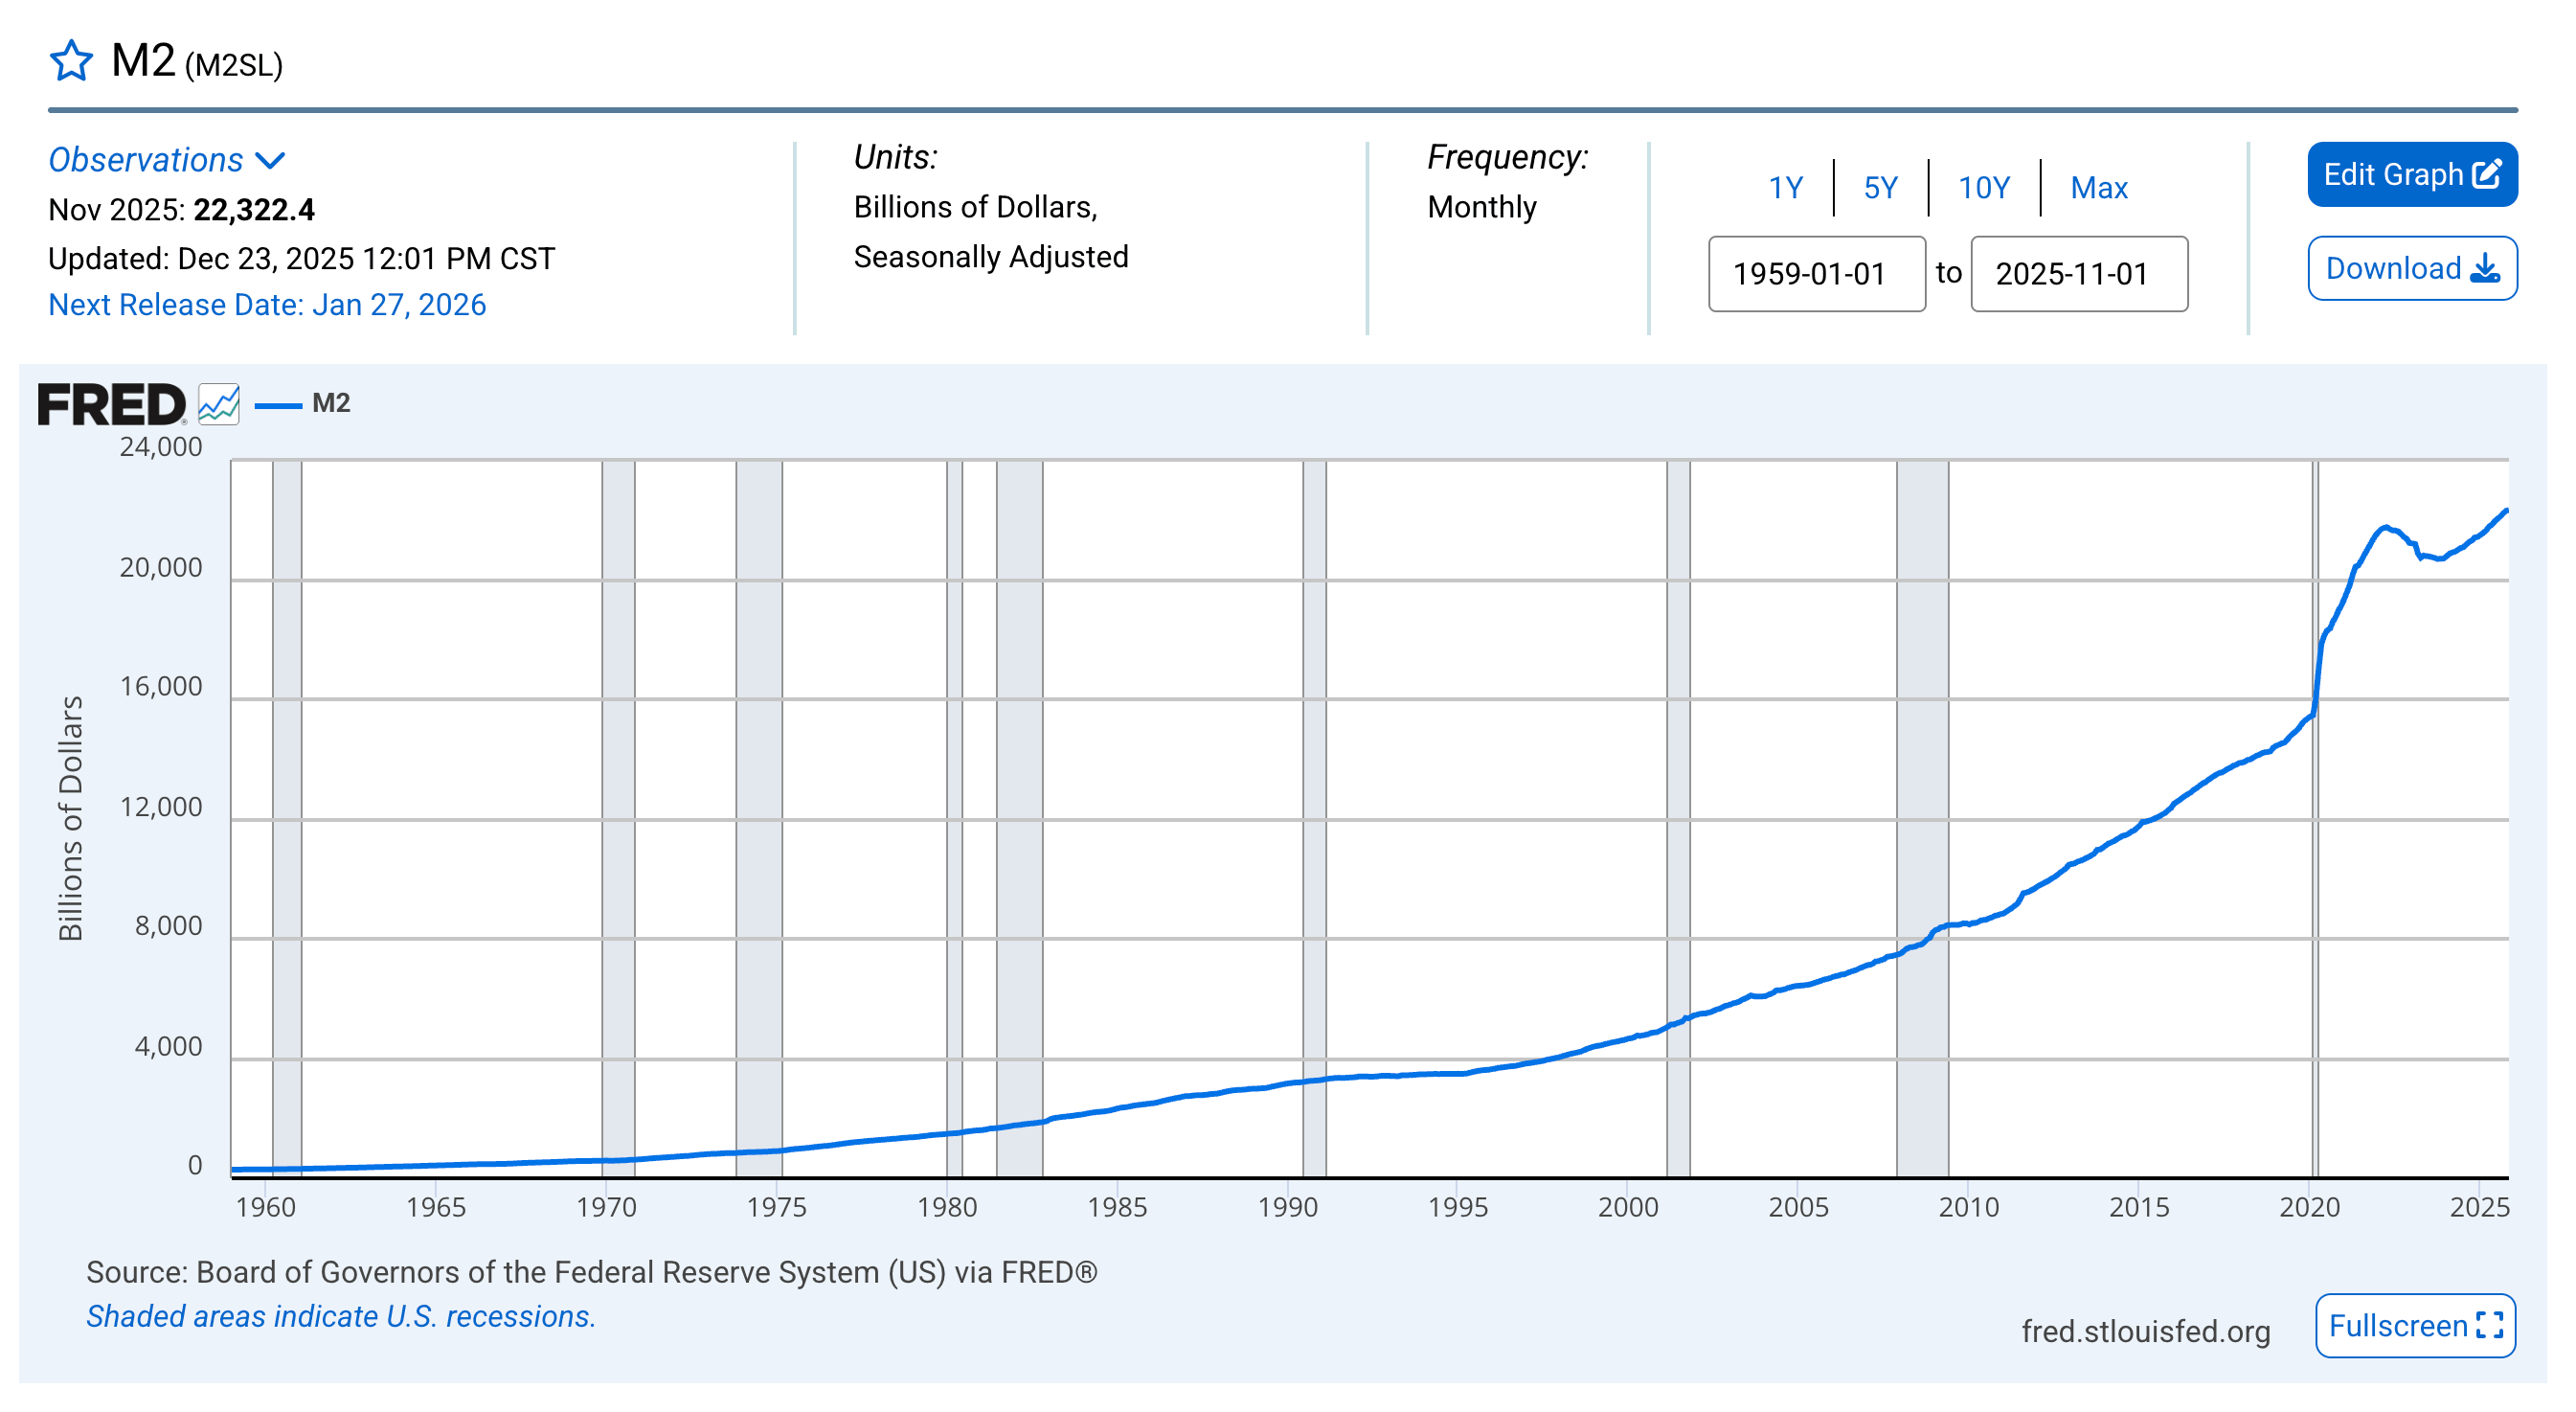
To get the full inflation picture, you need to look at the trajectory of the money supply.
By that metric, we have plenty of inflation, and it is accelerating!
As the Federal Reserve revs up the money-creating machine even higher, the money supply is already growing at the fastest rate since July 2022, in the early stages of the tightening cycle.
After peaking in April 2022, the money supply began to decline as the Fed hiked rates that year. The money supply bottomed in October 2023 and began increasing again. The money supply is now well above the pandemic peak.
And money creation has accelerated over the last several months.
We also know inflationary pressures are increasing because the Federal Reserve is once again expanding its balance sheet.
While you’ll never hear anybody at the Fed utter the term, the central bank relaunched quantitative easing last month. That means they are once again buying U.S. Treasuries using money created out of thin air.
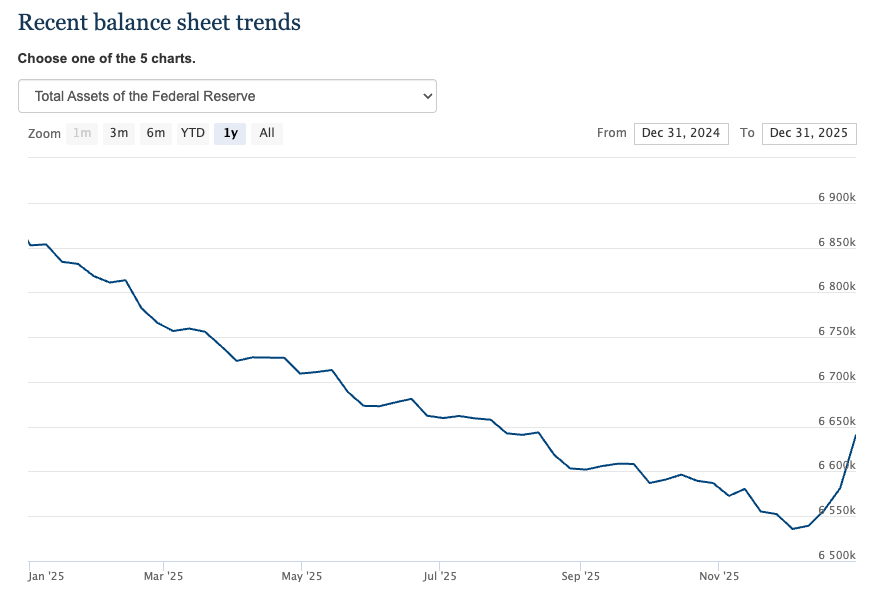
Again – this is by definition inflation.
So, why would the central bank continue to loosen monetary policy even when faced with sticky inflation?
Because, as I have been saying for months, the Fed is in a Catch-22.
The Fed needs to cut interest rates and run quantitative easing to support the debt-riddled bubble economy. But it also needs higher rates to keep price inflation under control.
Obviously, it can’t do both.
Any “cooler than expected” CPI report will throw more fuel on the easing fire and raise the possibility for more this year, despite the central bankers’ efforts to tamp down expectations for further easing.
In other words, you get more inflation — despite what the CPI data might indicate.
Mike Maharrey is a journalist and market analyst for Money Metals with over a decade of experience in precious metals. He holds a BS in accounting from the University of Kentucky and a BA in journalism from the University of South Florida.