
(Jan Nieuwenhuijs, Money Metals News Service) As we are in the final stages of a debt cycle that is causing gold to skyrocket, the question arises: how high can gold go?
Comparing the current bull run to the previous two points to a gold run as high as $16,000 per ounce.
I typically analyze the gold price through a framework of how gold relates to “credit assets” (national currencies, debt securities, equity, etc.). Simplified, trends in the ratio between gold and credit assets tell us where we are in a debt cycle, and where we are in a debt cycle reveals in what direction the gold price is heading.
In an economic boom, capital flows into credit assets (debt), and the gold price stalls. When markets exhibit excessive confidence in credit, financial bubbles tend to form.
When the bubbles pop, investors flock to gold until a new equilibrium is established in the financial system between money without counterparty risk (gold) and assets with counterparty risk (credit).
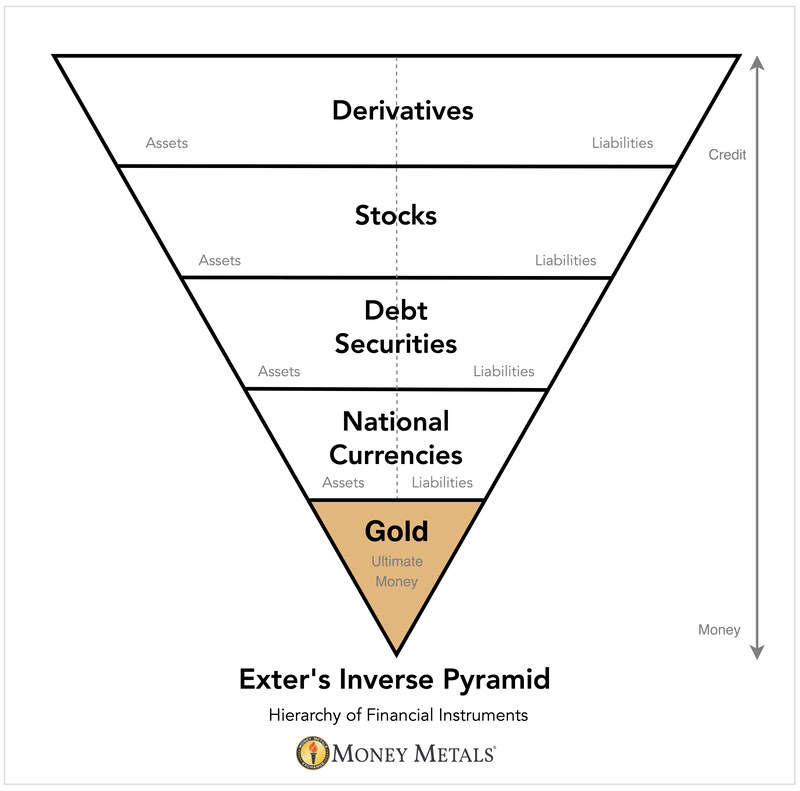
Our version of the financial system based on Exter’s inverse pyramid.
We will use a gold-to-credit ratio to examine debt cycles wherein the S&P 500 stock index is divided by the gold price. As can be seen in the chart below, this ratio shows there have been four debt cycles over the past 100 years.
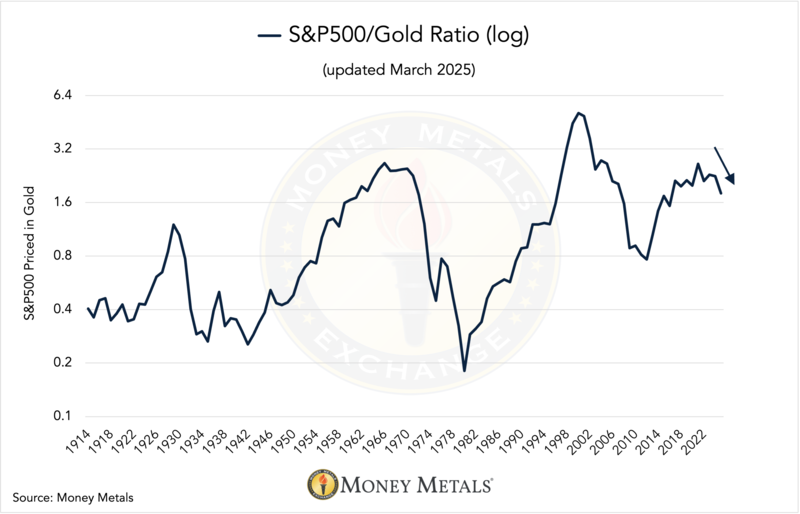
The S&P 500 index priced in gold can be used as an indicator for peaks and bottoms of debt cycles. For more examples, go here.
The first cycle ended in the late 1920s, the second in the 1970s, the third after the dot-com bubble, and the fourth is ending as we speak.
To get a sense of how high the gold price can go during this bull market, let’s compare its price action to the two previous bull markets. (The gold price jumped up in 1933 due to a one-off devaluation of the dollar against gold, so we can’t use gold price data from that period.)
From 1970 until 1980, the price of gold rose 23-fold. From 1999 until 2011, gold went up 6.5X. On average, that’s a 16-fold increase. Measured from the most recent bottom in 2015, gold going up by 1700% would produce a price peak of over $16,000 per ounce.
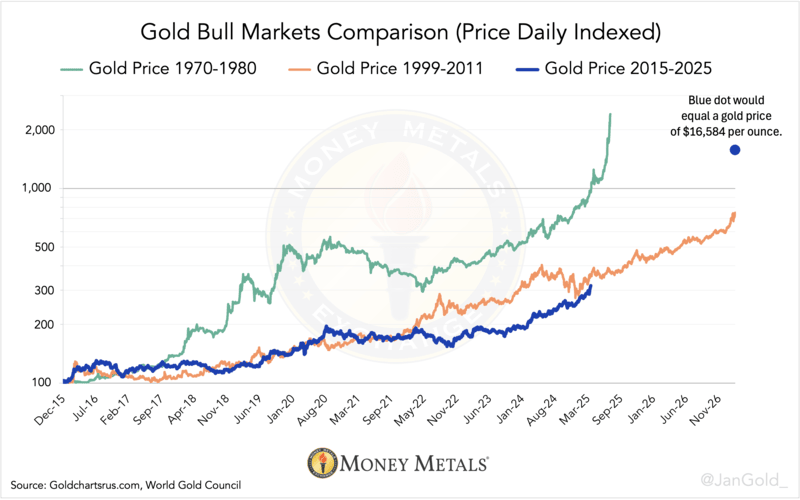
Gold bull market comparison between today’s bull market and the two previous ones.
When gold was trading at $2,700 an ounce in January, I calculated that gold could reach $8,000 this decade. While I feel more comfortable sticking to my conservative estimate, I wouldn’t be surprised if gold overshoots big time. If history is any guide, it will.
Originally a sound engineer in the Dutch movie industry, Jan Nieuwenhuijs has devoted the last decade to in-depth gold market research. His commentary and analysis has earned him international recognition as a top expert on the Chinese gold market, the COMEX futures market, the London Bullion Market, and the Turkish gold market. At Money Metals, he writes about the international monetary system, central bank gold policies, the mechanics of the global gold market, the gold price, and economics in general.