
(Mike Maharrey, Money Metals News Service) The U.S. debt has reached yet another ominous milestone.
In March, the national debt surged over $39 trillion. Now, the federal debt held by the public-to-GDP ratio has crossed the 100 percent threshold.
In other words, the U.S. government owes the world more money than the economy’s total annual output.
And it’s actually worse than that. There is additional federal debt not factored into the data that produced this eye-bulging headline.
The last time the debt held by the public exceeded GDP (briefly) was when governments effectively shut down the global economy during COVID. Before that, the debt-to-GDP ratio hadn’t exceeded 100 percent since World War II.
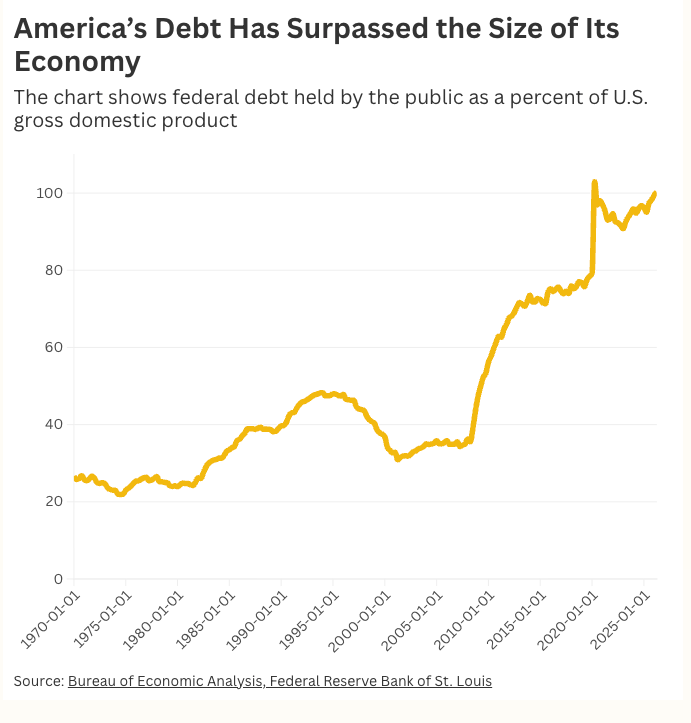
To put this “achievement” into perspective, the average debt-to-GDP ratio has historically hovered around 50 percent.
The news created some stir over the weekend, as such news often does. But as Newsweek noted, “Congress appears uninterested in countering” the trajectory of the debt.
Committee for a Responsible Federal Budget President Maya MacGuineas pointed out that despite the general apathy toward Washington, D.C.’s borrowing and spending problem, it has real negative impacts on the economy.
“The debt slows economic growth, pushes up borrowing costs and prices, and leaves us vulnerable to a fiscal crisis in the future. There are good milestones, and bad ones, and this is the worst kind there is.”
In a well-known paper, published in 2010, economists Carmen Reinhart and Kenneth Rogoff show that when debt to GDP crosses the 90 percent threshold, it retards median economic growth by 1 percent, and average growth falls considerably more (up to 30 percent).
While it generated some headlines out there in the mainstream, the debt-to-GDP ratio rising above 100 is just a symbolic event. As Newsweek noted, it doesn’t create an immediate crisis. But anybody who doesn’t recognize this is a problem is out of their mind.
Unfortunately, it appears that most elected officials are out of their minds – or they have their heads buried in the sand. They read these headlines. A few might express concern. And then they go right back to spending money.
And make no mistake – this is a spending problem. Federal revenues have been at a record level over the last year. Meanwhile, Uncle Sam spent $3.65 trillion through the first half of fiscal 2026. That was up about 2 percent over the same period in fiscal ‘25.
A 2 percent increase in spending might not sound significant. But weren’t we told there would be spending cuts?
Even with all the hype about DOGE and some lip service to cutting spending during the early days of the Trump administration, the U.S. government spent just over $7 trillion last year. That’s an average of $583.3 billion per month or $19.2 billion per day.
And now there’s a war.
Despite some nonspecific talk about “spending cuts,” there seems to be little to no commitment to dealing with the runaway spending.
The Debt-to-GDP Is Even Worse Than the Headlines Suggest
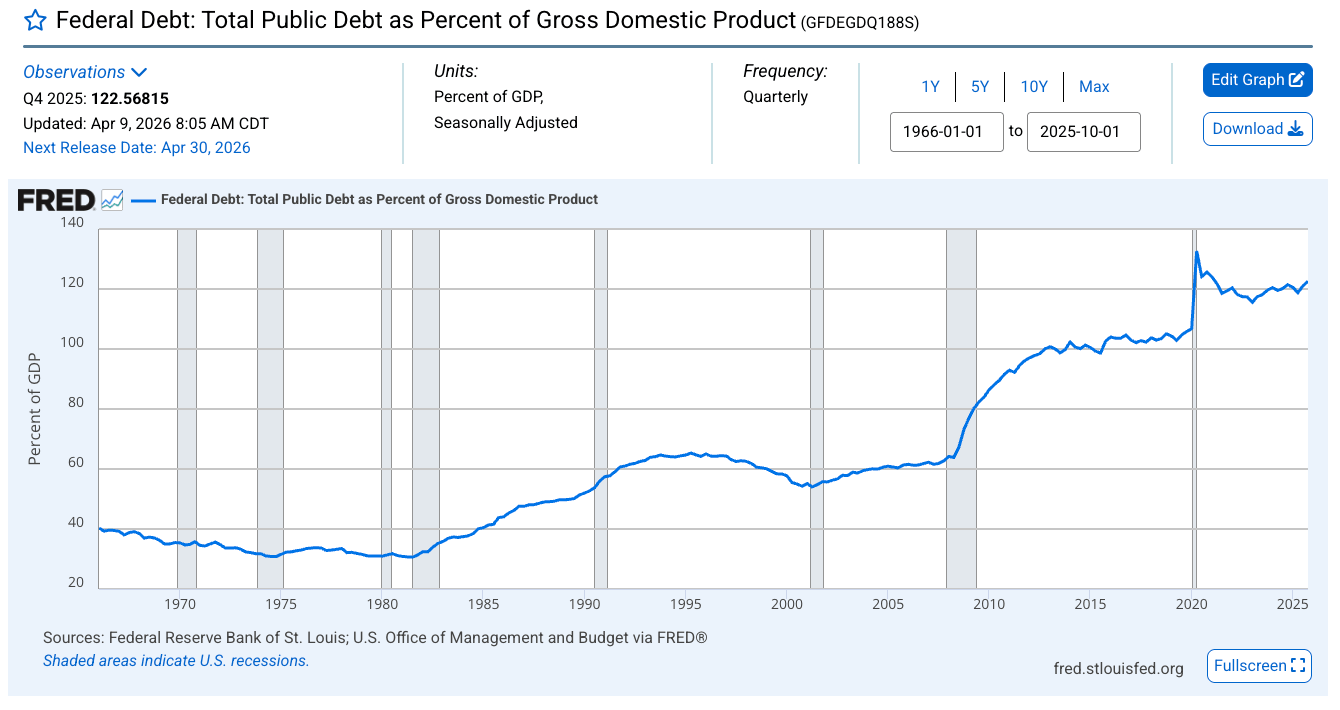
If you go to the national debt clock, it shows the debt-to-GDP ratio at 122 percent. It’s been in that range for well over a year.
So, why are mainstream news outlets just now reporting a debt-to-GDP ratio crossing the 100 percent threshold?
Because they are measuring the debt-to-GDP in different ways.
The National Debt Clock factors in all the debt that has been issued by the federal government (gross debt). This includes the debt held by the public plus “intragovernmental holdings,” essentially money the government owes to itself. For instance, if the Social Security Administration runs a surplus, it invests in U.S. Treasuries.
Of the $39.1 trillion in debt, around $7.8 trillion is made up of intragovernmental holdings.
While one can argue that government debt held by the government is nothing but internal governmental accounting, those Treasuries held by other federal agencies must be paid off with dollars at some point, so they are “real” debts.
And no, the National Debt Clock is not inflating numbers just to make things look worse than they are. The Federal Reserve maintains the same data.
Both these numbers are relevant.
The debt held by the public (the lower number used to generate the recent headlines) is more relevant in determining the economic burden of the debt and the pressure on the bond markets. The gross debt used to determine the National Debt Clock debt-to-GDP ratio is more relevant when determining the fiscal sustainability of this borrow-spend regime.
And keep in mind that none of this takes into consideration the unfunded obligations looming in the future. That pushes the debt to over $100 trillion.
No matter how you slice and dice the numbers, they spell b-a-d n-e-w-s.
And very few people seem to care.
It’s easy to play “kick the can down the road” with the debt. Everything seems OK now. After all, people have been worrying about the debt for decades, and nothing bad has happened. There are virtually no political incentives to deal with the debt problem. That’s because there is no path out other than drastic spending cuts. (No, you can’t solve the problem by taxing billionaires.) Politicians’ number one priority is getting reelected. You don’t get votes by cutting people’s favorite programs.
So, on down the road the can goes.
Of course, the problem with kicking the can down the road is that you eventually run out of road.
Mike Maharrey is a journalist and market analyst for Money Metals with over a decade of experience in precious metals. He holds a BS in accounting from the University of Kentucky and a BA in journalism from the University of South Florida.