
(Jesse Colombo, Money Metals News Service) Although gold has been relatively quiet in recent months following a strong start to the year, many investors have lost interest or assumed the rally has run its course.
However, I believe gold may be setting up for another powerful advance, with the potential to surge to around $4,400 in short order.
I’m now seeing clear similarities to the price action we saw in November and December, when gold also moved sideways for a time before launching a dramatic $900 rally in early 2025.
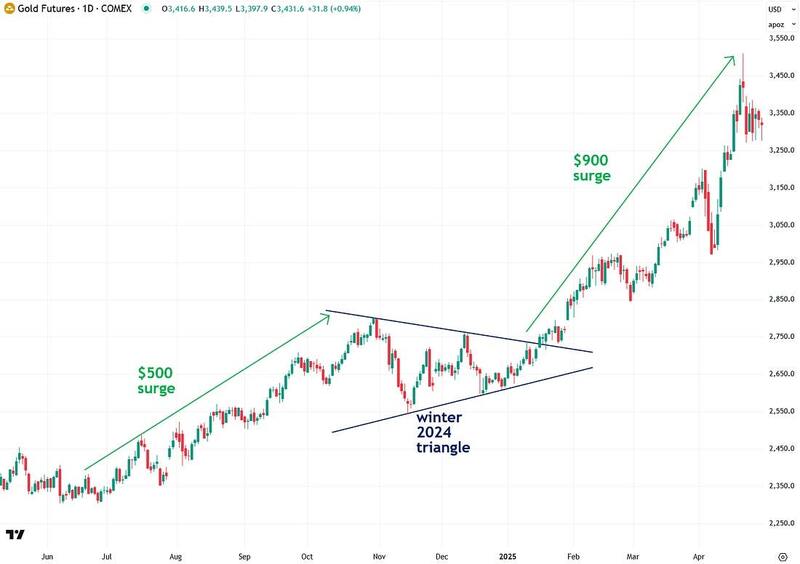
Let’s begin by revisiting gold’s behavior in the winter of 2024, when it formed a triangle pattern that ultimately led to an impressive $900-per-ounce rally:
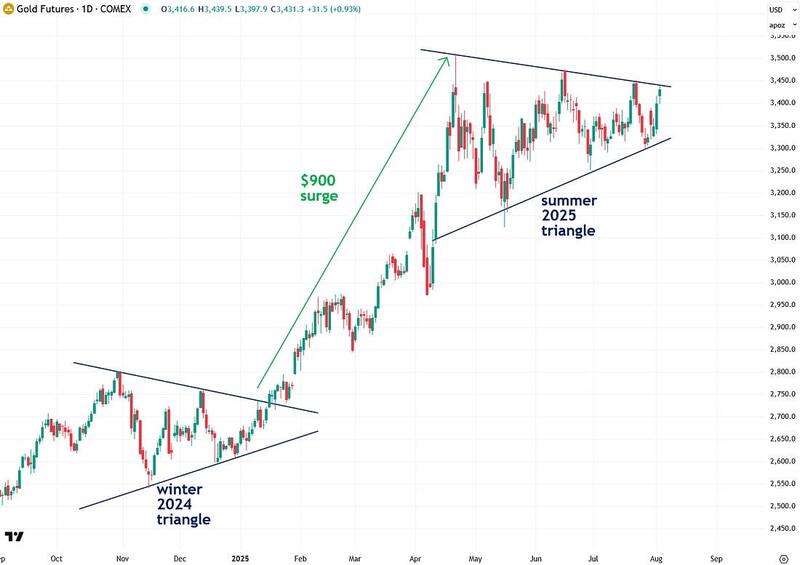
Now take a look at gold’s current chart below and observe the triangle pattern that has taken shape over the past few months. It looks remarkably similar to the one that formed in November and December.
It’s also worth noting that this pattern has developed during the summer—a time typically marked by lighter news flow and reduced trading volume, as much of the financial world is in vacation mode. Since volume is the lifeblood of financial markets, this seasonal lull makes the current setup all the more significant.
To confirm my theory that gold is on the verge of another powerful rally, we need to see a decisive breakout from the current triangle pattern accompanied by strong volume.
The return of Wall Street in September is likely to coincide with the move and provide the necessary fuel to propel it higher. Again, this bullish scenario will remain unconfirmed until a clear breakout occurs.
Interestingly, there’s an effective way to estimate how far gold is likely to rally once it breaks out of its current triangle pattern. It involves a principle in technical analysis known as the measured move. This technique projects a potential price target based on the size of the prior move and often proves to be remarkably accurate.
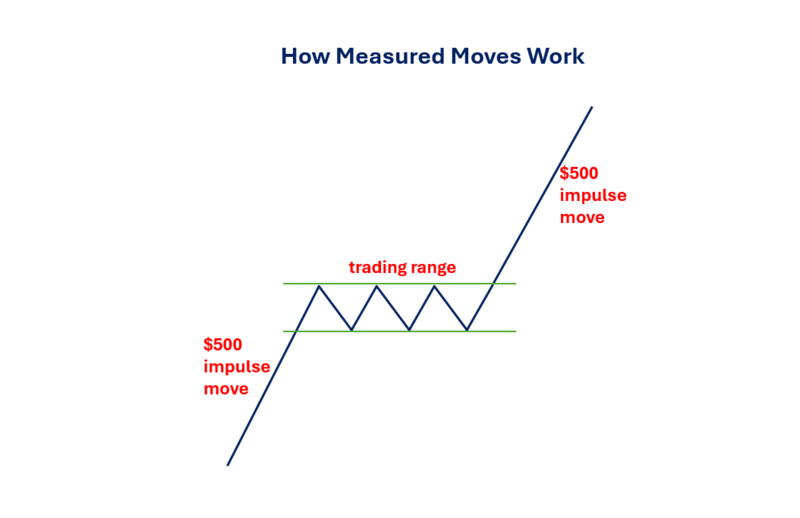
I created the diagram below to illustrate how measured moves work. It begins with an initial impulse move—such as the $500 advance shown in the example. After that surge, the market or asset pauses to consolidate its gains. This consolidation phase can take various forms, such as a sideways trading range or a triangle pattern.
Once the consolidation is complete, the asset breaks out and resumes its rally, typically rising by an amount equal to the initial move—in this case, another $500. It’s a straightforward concept, but a powerful one.
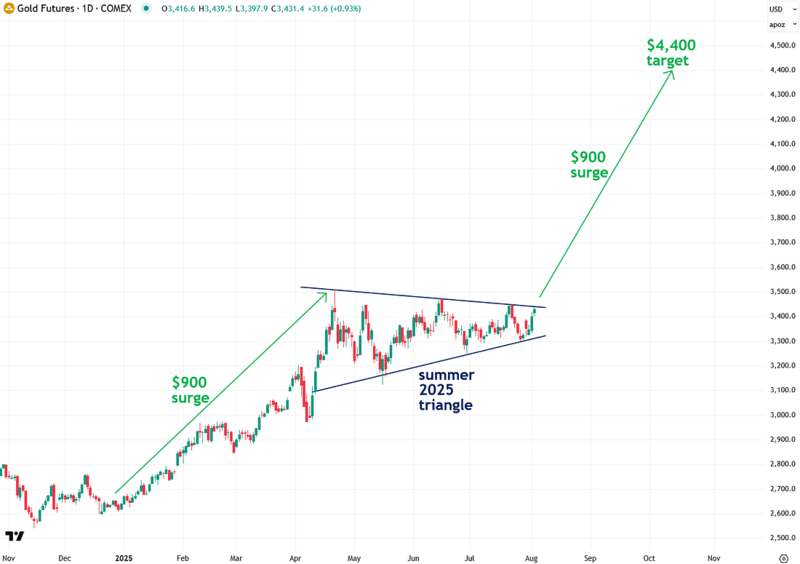
So let’s return to the current triangle pattern in gold and examine how high it could rally using the measured move principle. The rally from January to April, which led into the current consolidation, was $900 per ounce.
According to this method, a breakout from the triangle would likely produce a similar $900 move—bringing gold to an impressive target of approximately $4,400, representing a very respectable 28% gain. It’s also worth noting that both JPMorgan and Goldman Sachs expect gold to reach $4,000 by 2026, so the $4,400 target is hardly far-fetched.
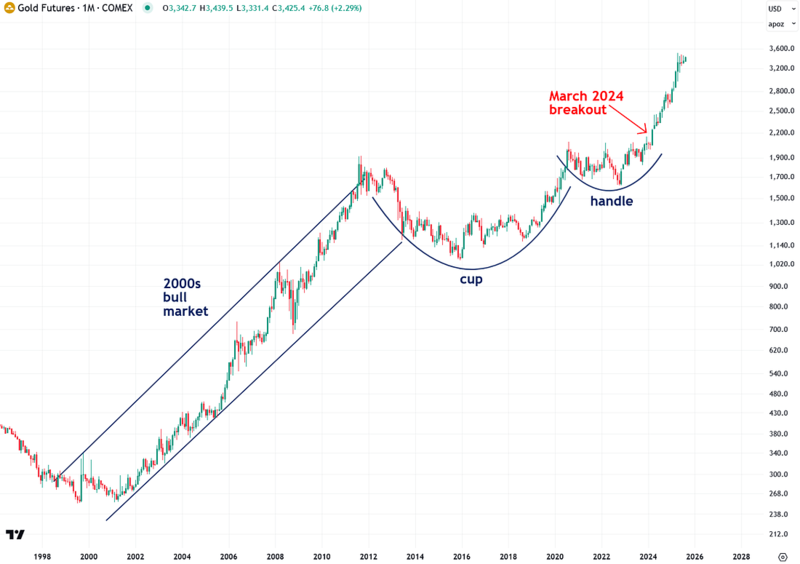
Another reason the $4,400 price target for gold isn’t far-fetched is that, in March 2024, gold broke out of a massive cup and handle pattern that dates all the way back to 2011.
Given the scale of that pattern, it indicates that gold’s bull market still has significant room to run. Historically, gold bull markets typically last a decade or more, as shown by the 2000s bull market highlighted in the chart below.
Now that I’ve outlined the technical case for a potential gold rally, I’d like to turn to several key fundamental factors that also support this outlook. The most immediate is the sharp increase in the odds of a U.S. Fed Funds rate cut in September—rising from around 45% to approximately 75% following Friday’s surprisingly weak jobs report.
The report showed that only 73,000 jobs were created in July, well below the 104,000 estimate. To make matters worse, employment figures for May and June were revised down by a combined 258,000, revealing that the labor market is much weaker than previously believed. The surging rate cut odds are bullish for gold and bearish for the U.S. dollar.
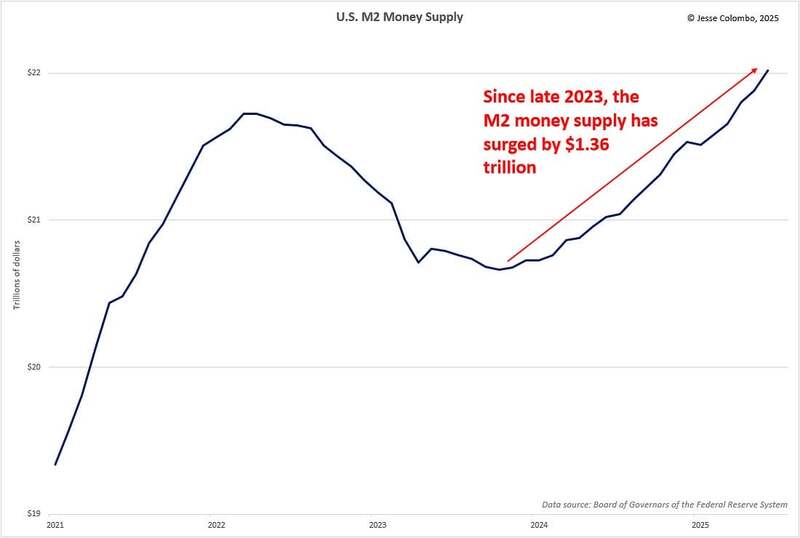
In addition, a major but often overlooked factor driving gold’s bull market since early 2024 has been the renewed expansion of the U.S. money supply, following a rare contraction in 2022 and 2023. Since bottoming in late 2023, the U.S. M2 money supply has surged by an alarming $1.36 trillion, reaching a record $22 trillion.
There is little reason to believe this trend will slow anytime soon. A rising money supply is the primary driver of inflation, and gold tends to respond strongly, often rising in tandem. Importantly, this is not just a U.S. issue but a global one.
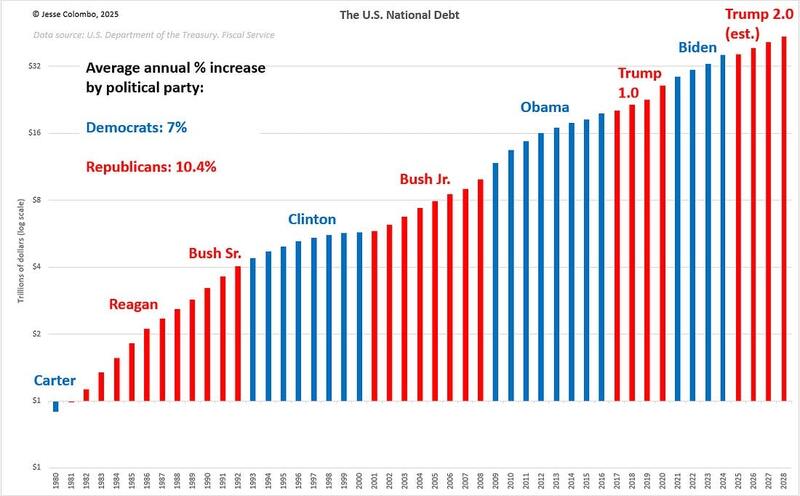
Another major source of fuel for gold’s ongoing bull market is the expected continued rise of the U.S. national debt. The debt has already reached a record high of $37.19 trillion and will easily exceed $40 trillion within the next few years, continuing a long-term upward trend.
This trajectory is expected to accelerate under the Trump administration’s One Big Beautiful Bill Act, which will add $3.4 trillion to the debt over the next decade and more than $4 trillion when accounting for additional interest costs.
As the chart below shows, both major U.S. political parties have consistently contributed to the rising national debt. They may differ in how they choose to spend, but the end result is the same: growing deficits. In that sense, it hardly matters who is in office, as both are bullish for gold.
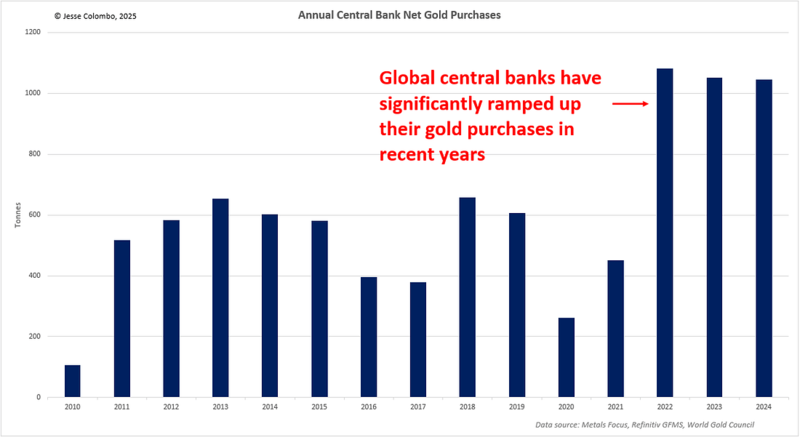
Further fueling gold’s continued rise is the insatiable demand from global central banks, which are increasingly diversifying their reserves into hard assets, which is a wise move. This strategy is intended to hedge against the surging global money supply, persistent inflation, and the mounting economic risks associated with historically high debt levels worldwide.
Since the 2020 COVID-19 pandemic, central banks around the world have significantly ramped up their gold purchases, averaging just over 1,000 tonnes per year in 2022, 2023, and 2024. This marks a dramatic increase of roughly double the annual average of about 500 tonnes in the preceding decade.
Moving along, a nascent capital rotation out of the overvalued U.S. stock market and into gold is emerging as a major driver of gold’s bull market, and it’s only just getting started.
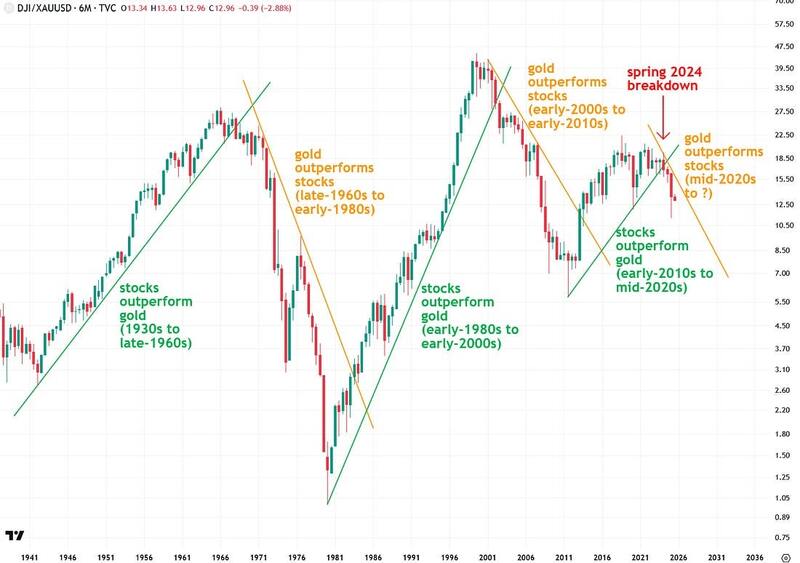
To understand capital rotation and the dynamic between stocks and gold—two essentially competing asset classes—it’s helpful to examine the long-term chart of the Dow-to-gold ratio, which is calculated by dividing the Dow Jones Industrial Average (DJIA) by the price of gold.
I focus on the Dow because it offers the longest historical data, but the same analysis can be applied to other stock indices, including international ones like Japan’s Nikkei and the UK’s FTSE 100.
The Dow-to-gold ratio chart I’ve created below spans all the way back to the early 1940s, using 3-month bars and a logarithmic price scale. When the ratio is rising, it indicates that stocks are outperforming gold; when it’s falling, gold is outperforming stocks. This chart is a powerful tool because it respects trendlines remarkably well—so much so that when the ratio breaks a key trendline, it signals the beginning of a new capital rotation era.
Stocks outperformed gold during several major periods: from the 1930s to the late 1960s amid the post–World War II economic boom, during the powerful bull market from 1982 to 2000, and again from 2012 to 2024 following the Great Recession.
Conversely, gold outperformed stocks during the stagflationary years of the late 1960s through the early 1980s, and again in the dot-com bust era from the early 2000s to the early 2010s.
Notably, a new era began in the spring of 2024 when the Dow-to-gold ratio broke below the uptrend line that had been in place since 2012. This breakdown signals a major shift: a powerful wave of capital flowing out of stocks and into gold—sending gold much higher from here, with silver riding that wave as well.
It’s also important to note that these capital rotation cycles typically last 10 to 15 years. That means we’re still in the early innings of a precious metals bull market—and the early stages of a prolonged period of underperformance for stocks.
What will further supercharge this capital rotation from stocks into gold is the extreme overvaluation of the U.S. stock market, which is clear evidence of a bubble of unprecedented magnitude. This indicates that a significant amount of capital will transfer into gold over the coming decade.
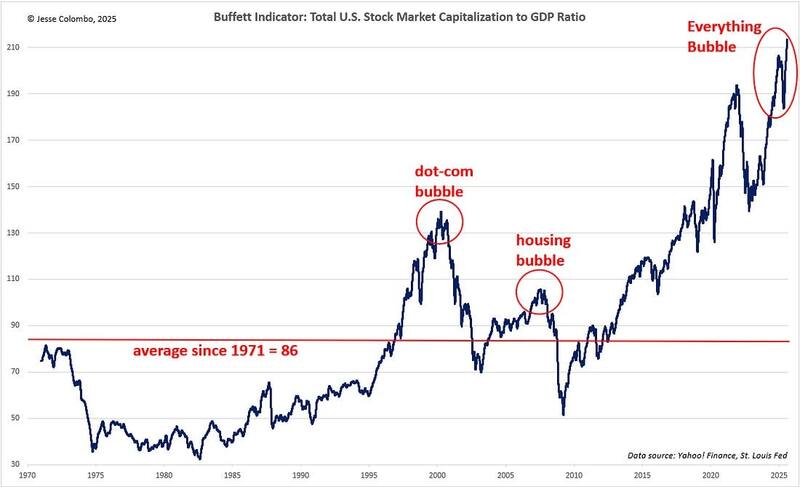
Virtually every major valuation metric confirms that stocks are in the midst of a massive bubble, but the one I want to highlight today is the “Buffett Indicator.”
This metric, which compares the total U.S. stock market capitalization to GDP, is a simple but highly reliable gauge of market valuation. It is named after billionaire investor Warren Buffett, who has called it “the best single measure of where valuations stand at any given moment.”
Currently, the Buffett Indicator stands at a staggering 214, which is 149% above its long-term average of 86, dating back to 1971. This level is even higher than the peak of the late-1990s dot-com bubble, which ended in a devastating crash.
Buffett himself warned that when the ratio approaches 200%, investors are “playing with fire.” The reason for this extreme valuation is that the stock market has surged far beyond the growth of the actual economy, a classic hallmark of speculative excess.
History has shown that valuations eventually revert to the mean, making the market highly vulnerable to a sharp and violent downturn. Given the current extremes, the risk of a major bear market is not a question of if, but when—and when it arrives, it will propel gold into the stratosphere.
Based on this and the other factors discussed in this piece, I believe gold will reach at least $15,000 per ounce in the next decade.
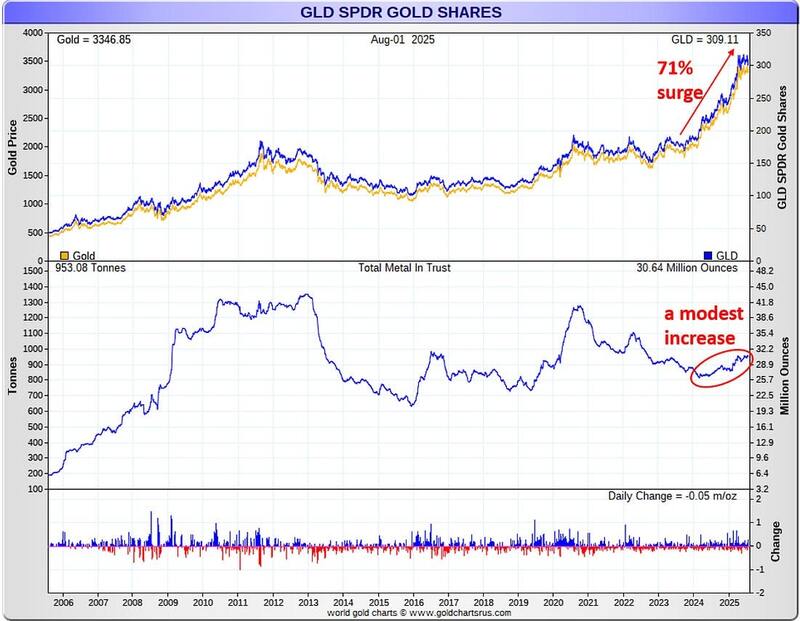
Finally, another major reason I believe gold’s bull market still has plenty of life left in it, and why the $4,400 price target could be easily reached, is that despite gold’s impressive 71% gain so far, the rally has been driven primarily by central banks and overseas investors, particularly in Asia. American and other Western investors have only entered the market in a tepid way so far. As their participation strengthens, the resulting influx of capital will supercharge gold’s bull market.
A prime example of this dynamic is the SPDR Gold Shares (GLD), the most popular American gold ETF and a widely used proxy for U.S. investor interest in gold.
Although the current bull market has been underway for a year and a half, GLD’s holdings have increased only modestly, rising just 16% to 953 tonnes. This remains well below the 2012 peak of approximately 1,350 tonnes, when gold was trading about 42% lower near the $2,000 level.
The implication is clear: when American investors eventually pour into gold ETFs and other gold vehicles, it will give the bull market a tremendous shot in the arm.
To wrap things up, I firmly believe that gold’s bull market is still in its early stages, with a wide range of powerful forces poised to drive it even higher.
These include the weakening U.S. job market and rising odds of interest rate cuts, renewed growth in both the U.S. and global money supply, the relentless increase in the U.S. national debt, continued strong gold buying by central banks, the beginning of a major capital rotation out of the highly inflated U.S. stock market, and a large amount of untapped buying power from U.S. investors who are only now beginning to re-engage with gold.
In the near term, I’m closely watching the triangle pattern that has developed in recent months, and I’m now waiting for confirmation of this thesis through a decisive breakout that is likely to propel gold well above $4,000.
All in all, these are incredibly exciting times to be a precious metals investor, and I believe gold and silver are positioned to be among the best-performing assets over the next decade.
If you found this report valuable, click here to subscribe to The Bubble Bubble Report for more content like it.
Jesse Colombo is a financial analyst and investor writing on macro-economics and precious metals markets. Recognized by The Times of London, he has built a reputation for warning about economic bubbles and future financial crises. An advocate for free markets and sound money, Colombo was also named one of LinkedIn’s Top Voices in Economy & Finance. His Substack can be accessed here.