(José Niño, Headline USA) The ATF improperly classified dozens of administrative positions as law enforcement roles, which allowed paper-shufflers to collect higher salaries and retirement benefits at the taxpayers’ expense, according to a scandal uncovered by Sens. Chuck Grassley, R-IA, and Joni Ernst, R-IA.
On Monday, the two senators sent a letter to Attorney General Pam Bondi, ATF Acting Director Daniel Driscoll, and Assistant Attorney General Jolene Ann Lauria. The letter outlines serious misconduct within the ATF and the Justice Department, specifically regarding the illegal misclassification of administrative positions as law enforcement roles.
According to the letter, the ATF misclassified human resources and administrative positions as law enforcement roles, allowing employees in these positions to illegally receive enhanced law enforcement pay and benefits.
Senior ATF officials, including HR Division Chief Ralph Bittelari and Deputy Assistant Director Lisa Boykin, were accused of knowingly falsifying and fraudulently certifying government records to support the misclassification.
Well, well, well. The only solution to this nonsense is ABOLISH THE ATF & REPEAL THE NFA!
— American Firearms Association (@2A_Freedom) May 13, 2025
The senators alluded to unreleased government audits and internal investigations that found the pair engaged in “gross and substantial waste, fraud and abuse,” including potentially criminal false certification of government records and retaliation against whistleblowers.
Per the senators, Boykin and Bittelari approved the reclassification of dozens of administrative positions as law enforcement roles, which allowed employees to collect higher salaries and enhanced retirement benefits.
The Office of Personnel Management (OPM) and ATF Internal Affairs Division confirmed the misconduct, finding that at least 108 positions were improperly classified between 2016 and 2021.
The illegal scheme cost taxpayers approximately $20 million over five years, with whistleblowers alleging the actual cost could be in the hundreds of millions due to relocation expenses and other factors.
Throughout this process, whistleblowers who exposed the misconduct faced retaliation, including demotions, damage to their reputations, and career setbacks.
Despite evidence of gross misconduct, the letter highlighted that ATF and DOJ leadership failed to take corrective action and instead promoted the officials involved in the scheme.
Additionally, the senators argued that the misclassification scheme undermined the ATF’s ability to carry out its law enforcement mission by relocating law enforcement officers to administrative roles.
The letter calls for immediate corrective action, accountability for the officials involved, and justice for whistleblowers who faced retaliation. It also requests a comprehensive review of ATF field offices to ensure taxpayer dollars are not wasted on illegally paying enhanced benefits to employees performing administrative duties.
“The Biden administration’s ATF illegally lined employees’ pockets with tens-of-millions of taxpayer dollars,” Grassley said in a statement. “These Washington bureaucrats must answer for their misconduct, and if heads don’t roll, nothing will change.”
Ernst echoed the call for accountability, saying, “It is unacceptable that the Biden administration looked the other way while ATF bureaucrats knowingly defrauded taxpayers to pad their salaries. These desk jockeys pretending to be law enforcement officers are about to get a crash course in the law.”
Grassley and Ernst are demanding that Attorney General Pam Bondi and Acting ATF Director Daniel Driscoll respond by May 23 with a plan for corrective action. “Federal employees are not above the law and stealing tax dollars is a crime,” Ernst declared.
Whether the Justice Department will take action or let the controversy fade remains to be seen, but senators have made it clear that the days of unchecked bureaucratic waste must end.
The ball is now in the Justice Department’s court as the nation waits for answers — and justice — in the wake of this costly scandal.
José Niño is the deputy editor of Headline USA. Follow him at x.com/JoseAlNino
“I think you may have a good result at the Thursday meeting in Turkey between Russia and Ukraine. I believe the two leaders are going to be there,” the president told reporters.
“I was thinking about flying over. I don’t know where I’m going to be on Thursday, I’ve got so many meetings, but I was thinking about actually flying over there,” he added.
Russian President Vladimir Putin first proposed the talks on Sunday, and Ukrainian President Volodymyr Zelensky initially responded by saying the negotiations were conditional on a ceasefire.
Zelensky appeared to back down on his position, saying on Monday that he was “ready” to travel to Turkey, though he still mentioned the idea of a ceasefire. “I am ready to come to Turkey. Unfortunately, the world still has not received a clear response from Russia to the numerous proposals for a ceasefire,” Zelensky said on X.
The Ukrainian leader also welcomed the idea of Trump attending the talks. “It is important that President Trump fully supports the meeting, and we would like him to find an opportunity to come,” Zelensky said.
European leaders are saying that Putin must agree to a ceasefire before the talks, but Trump has called on Ukraine to accept Russia’s proposal for negotiations without preconditions.
So far, the Kremlin has not confirmed that Putin is willing to attend the talks himself. “Moscow has remained silent all day regarding the proposal for a direct meeting,” Zelensky said.
Kremlin spokesman Dmitry Peskov said on Monday that Putin’s approach to the talks was “aimed at finding a real diplomatic solution to the Ukrainian crisis, eliminating the root causes of the conflict, and establishing lasting peace.”
(Peter Krauth, Money Metals News Service) The Silver Institute recently released its highly anticipated annual World Silver Survey 2025 (WSS). It’s one of the few deep reviews of the silver markets, and it’s compiled by Metals Focus for the Silver Institute.
With the benefit of hindsight, the authors look back at 2024 and give us their final numbers for silver supply and demand. In addition, they provide their outlook for 2025.
I will summarize what I think are the key points and trends, and where my views differ.
Silver supply came in nearly flat, up just 2% over 2023. Mine output gained 1%, while recycling was up a more significant 6%. However, recycling represents only 19% of overall supply, with mining accounting for the rest.
Interestingly, supply from primary silver mines continues to fall, down 2%. This chart shows silver mine production by source metal last year:
The Survey forecasts mined output to rise again this year by 2% as Mexico, Chile, and Russia grow production. Notably, Bolivian silver production reached a record high of 47.9 Moz.
It seems most of the rise in silver production was a byproduct of higher gold production. Strong and rising gold prices would explain higher gold output. Fully 72% of silver output was derived as a byproduct, with lead and zinc leading the way.
Silver production costs were down, with cash costs at $7.64 (down 15% over 2023) and AISC at $14.58 (down 13% over 2023), mainly due to higher byproduct metals prices. Intuitively, we might expect higher silver production as profits are attractive at current prices. But high silver prices do little to motivate miners who produce silver as a byproduct.
Recycling supply of silver was up 6%, mostly from industrial sources, and more specifically from the processing of spent ethylene oxide catalysts. There was also growth in jewelry scrap (+8%) and silverware (+11%). Higher silver prices and challenging economic conditions likely led some to sell their silver.
Demand
The Survey indicates that overall demand was down slightly in 2023 and again in 2024 (-3%). The biggest contributor here is coin and bar demand for physical silver (-22%), as well as photography (-7%) and silverware (-2%).
Total industrial demand was up 4% to reach 680.5 Moz, though it’s expected to be nearly flat (-0.5%) in 2025.
The WSS sees overall electrical and electronics (including solar) to be up 1% this year, solar down -1%, photography -5%, jewelry -6%, and silverware -15%. They expect coin & bar demand to be up 7%.
Here’s one area where I differ with the Survey. They indicate that demand from solar (photovoltaics) came in at 197.6 Moz for 2024. Their forecast back in April last year was for 232 Moz. I think the actual demand was closer to their forecast.
Recent research by BMO Capital Markets says they see solar consuming 246 Moz silver this year, up 5.5% from 2024. That would peg 2023 demand at 233 Moz, which is nearly exactly what the World Silver Survey had forecast for 2024.
The WSS has forecast solar demand for silver at 195.7 for 2025. BMO has forecast a rise to 261 Moz. That’s a difference of 33%. I believe that the BMO forecast is likely to come in closer to actual.
The WSS argues that silver loadings – the amount of silver required for each solar panel – will continue to fall, outweighing gains in cell production.
On the other hand, BMO notes that since 2016, the International Energy Agency has significantly underestimated the growth of solar power, which has grown at an annual compound rate of 20% since 2011 and is likely to continue at that pace through 2030. BMO expects overall solar power demand will outweigh thrifting.
BMO also points out that China’s domination of the solar panel market has driven prices down significantly. And despite the U.S. applying tariffs on Asian solar panels to counteract dumping, most of the rest of the world will find such low prices too attractive to overlook.
With the new trend towards deglobalization and self-reliance, the desire to use solar for energy independence will be irresistible.
As BMO explains it, “While some countries (notably the U.S.) will seek to counter Chinese cell dumping to support local industry, we expect that the opportunity to rapidly expand clean energy generation with limited upfront capex will be too enticing to resist for most of the world,” the analysts said.
“As such, we see solar as a market that is effectively not demand-constrained for the foreseeable future.” [emphasis mine]
Of course, this again begs the question of why silver hasn’t rallied to much higher levels. The Survey points out that above-ground silver stocks – mainly in London, New York, and Shanghai – have been gradually depleted, helping to meet the ongoing silver deficits of the last four years.
It’s also worth noting that Metals Focus, the group that produces the annual Survey, lists demand from silver ETFs (ETPs) as a separate line item that is not included in overall total demand. The argument is apparently that the silver in ETPs is not consumed, so is technically available to meet demand.
And yet investment demand in coins and bars form is included in overall demand. This makes no sense to me because that silver is not consumed either. It remains available to come back to the market at any time.
My biggest takeaway on this topic is the following. If you consider net investment in ETPs, then the deficit in 2024 was 210.5 Moz, the second highest on record, and the forecast deficit for 2025 is 187.6 Moz, which would be the third highest on record.
Key Takeaways
There are a few key takeaways from the World Silver Survey.
· The authors believe that there is a risk to silver demand from US tariffs that could lead to supply chain disruptions and lower economic growth globally. They feel that would weigh on industrial, jewelry, and silverware demand, but expect physical investment could rise as safe haven demand jumps.
I essentially agree with that conclusion, but feel that industrial demand could bounce back quickly as central banks move to cut interest rates, launch quantitative easing, and governments announce large stimulus programs to counter economic slowdowns.
· Although the past four years have seen a significant supply deficit, the report does not expect mine production to provide any real relief, as they see that peaking in 2026, then falling as several mines reach the end-of-life.
This is a key point as it suggests that deficits will need to be met from above-ground inventories. I think this will mostly happen at much higher silver prices.
One other important takeaway is the swing in net investment in ETPs (see line 2, above table). While that was -37.6 in 2023, it swung to +61.6 in 2024. That’s nearly a 100 Moz swing higher, and the forecast is for another +70 Moz into ETPs this year. If that’s the case, then ETPs will drain available secondary supplies from exchanges and private holdings.
That suggests that ongoing deficits will increasingly have to be met from private holdings as exchange inventories dry up.
In an interview with Kitco News, Metals Focus Managing Director Philip Newman indicated that even after five years of supply deficits, the market remains far from equilibrium: “Ultimately, we still think there’s a few years left of a deficit and that should prove to be price positive, even though in the short term we could continue to see some volatility.”
Newman further stated, “…Even in a recession, I don’t think you are going to see demand fall off a cliff. There is always some risk, but I do see some resilience in the silver market.” And he added that economic uncertainty could restart investment demand as silver’s safe-haven status is rediscovered.
In my view, we are looking at ongoing deficits and stronger demand than the WSS is forecasting, likely from both industrial and investment demand.
With that in mind, I expect the silver market’s constrained supplies coupled with robust demand to help drive new highs this year and for many more ahead.
If you found this information insightful, please be sure to subscribe to Peter Krauth’s Silver Stock Investor HERE.
Peter Krauth is the author of the bestselling book The Great Silver Bull, publisher of the silver-focused investment newsletter Silver Stock Investor, and is affiliated with The Gold Advisor.
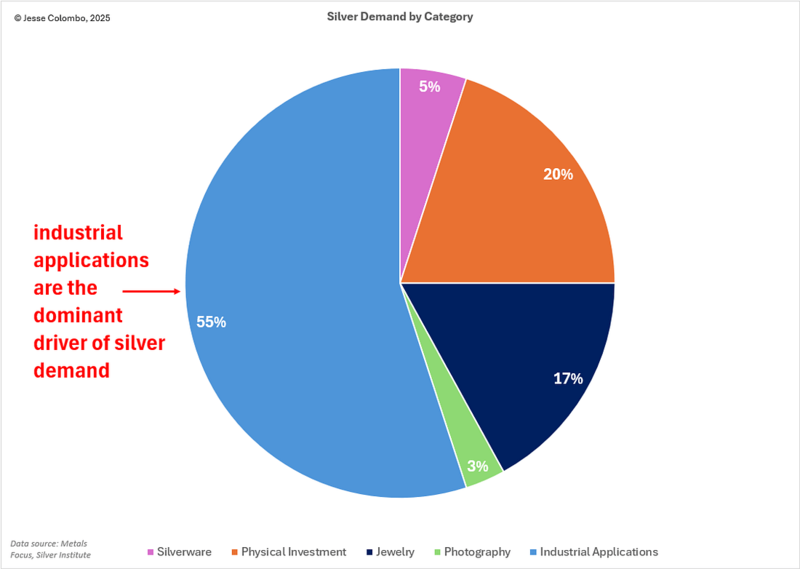
(Jesse Colombo, Money Metals News Service) As a silver investor and analyst, I closely track copper because of its strong correlation with—and influence on—silver. Silver is unique in that it’s both a precious metal and an industrial one, with industrial demand making up about 55% of total usage. This gives silver price behavior that often mirrors copper, a purely industrial metal.
Additionally, there are trading algorithms that arbitrage the silver-copper relationship, reinforcing their tight price connection.
In this article, I’ll break down where copper stands now and what it is signaling for silver.
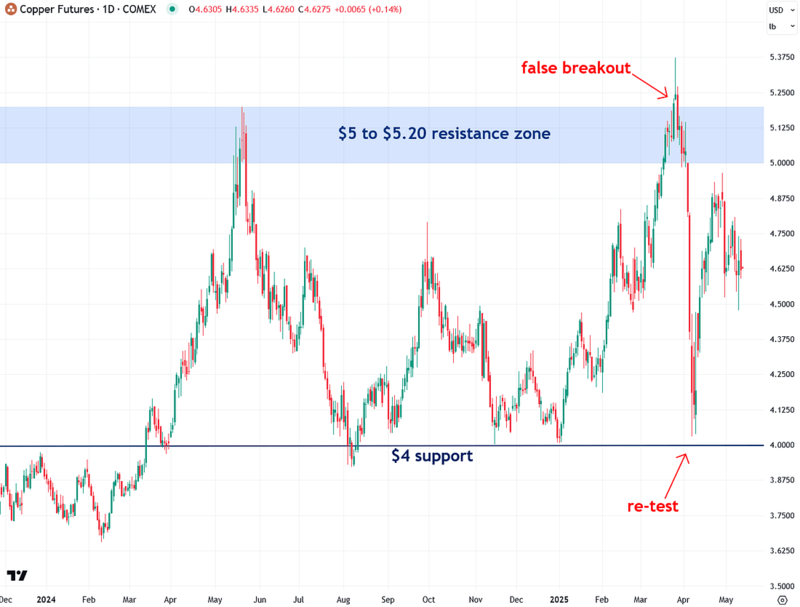
Let’s start with copper’s daily price chart. For much of the past year, I’ve highlighted the key $4-per-pound support level as a major line in the sand.
Each time copper has tested that level, it’s presented a high-probability bounce opportunity—which has played out multiple times, including at the very start of this year. In that instance, copper rebounded sharply and surged 34% to a high of $5.37 by late March, driven by a rush to bring copper onshore ahead of potential tariffs on imported supplies.
In late March, copper attempted to break above the $5 to $5.20 resistance zone—a key ceiling that has held since 2021—but the breakout ultimately failed.
Copper soon fell back below that level and was hit hard along with most other markets starting on April 2nd, known as “Liberation Day,” when President Trump unveiled his new tariff plan.
This serves as a valuable reminder of why flexibility and responsiveness to market signals are essential. When a breakout or breakdown fails and the price reverses, the reason doesn’t matter—that shift alone is a signal worth respecting.
False breakouts and breakdowns are common, especially in volatile environments like this one, where new policies are being introduced rapidly and often unpredictably.
Markets tend to react unpredictably under Trump’s leadership style, which is rooted in surprise and negotiation—traits consistent with his “art of the deal” philosophy—making trading much more challenging when he is at the helm.
Interestingly, after the “Liberation Day” shock and broad market selloff, copper retested the critical $4 support level before bouncing sharply and reclaiming much of its losses—a confusing round-trip move that left many investors and traders scratching their heads (myself included).
Over the past couple of weeks, copper has been consolidating around the $4.70 level, with no clear directional signal for now.
That said, I believe there’s a strong chance copper will soon make another run at the $5 to $5.20 resistance zone—this time with a higher likelihood of breaking through and launching a more sustained bull market, as I’ll explore further in this article.
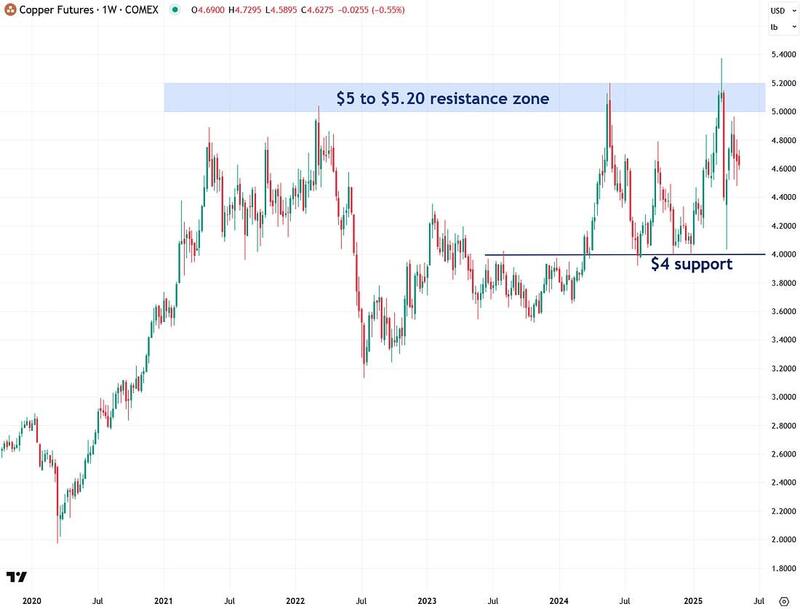
A look at the longer-term weekly chart highlights the significance of the $4 support level below and the $5 to $5.20 resistance zone above, with copper currently trading in the middle of that range.
For now, it remains in a holding pattern, offering no clear directional signal either way.
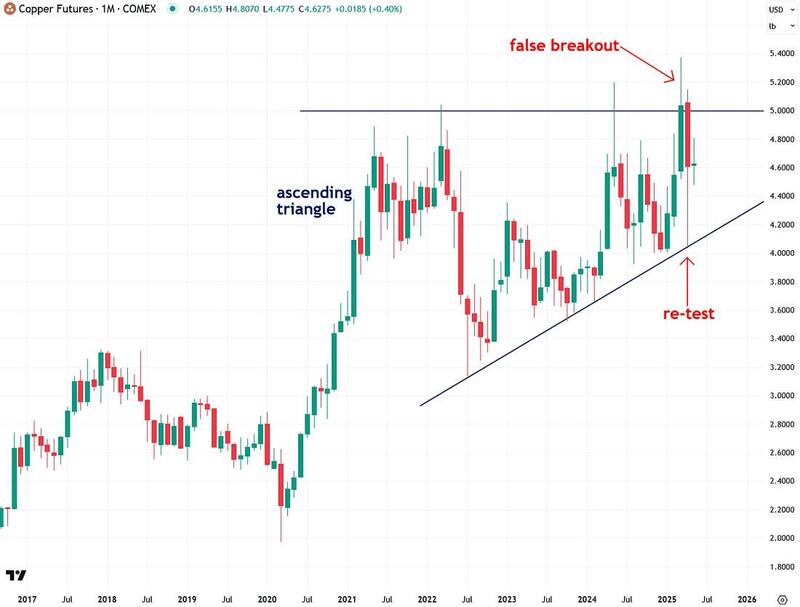
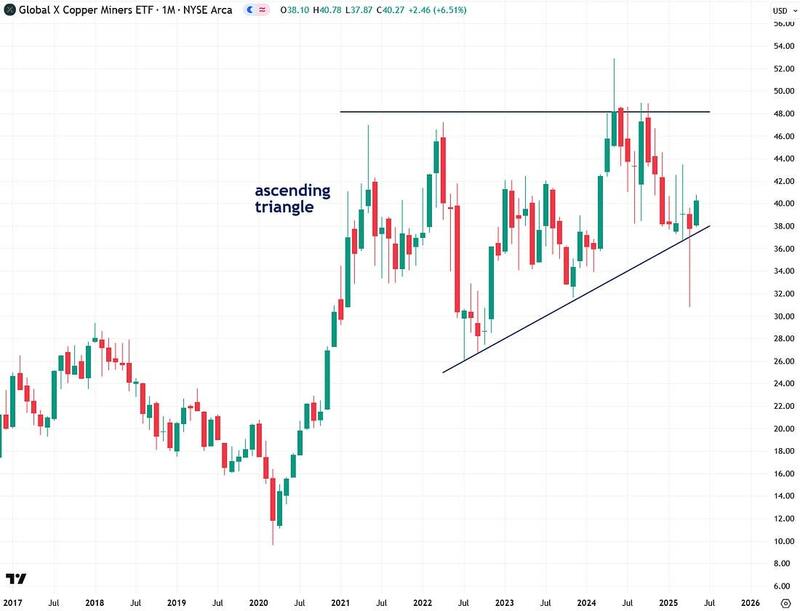
The even longer-term monthly chart reveals that copper’s consolidation since 2021 is forming an ascending triangle pattern—a classic bullish setup. This indicates that a major bull market will likely begin once copper finally breaks above the key $5 to $5.20 resistance zone.
If confirmed, I believe this move will mirror the strength of the 2020 rally that preceded it. Using the measured move principle in technical analysis, the breakout projects a potential $3 per pound advance—taking copper to $8, which represents a 73% gain from current levels.
I’m also seeing a similar ascending triangle pattern forming in copper mining stocks, as indicated by the Global X Copper Miners ETF (COPX).
I believe that once both copper and COPX break out of their respective patterns, it will spark a powerful bull run in copper stocks—one I’m eager to participate in, as it aligns with my broader bullish outlook on commodities, which I’ll delve into shortly.
It’s also worth noting that copper and silver mining stocks are closely correlated, since silver is often produced as a byproduct of copper mining. That overlap means a bull market in copper miners would likely coincide with a strong rally in silver miners as well.
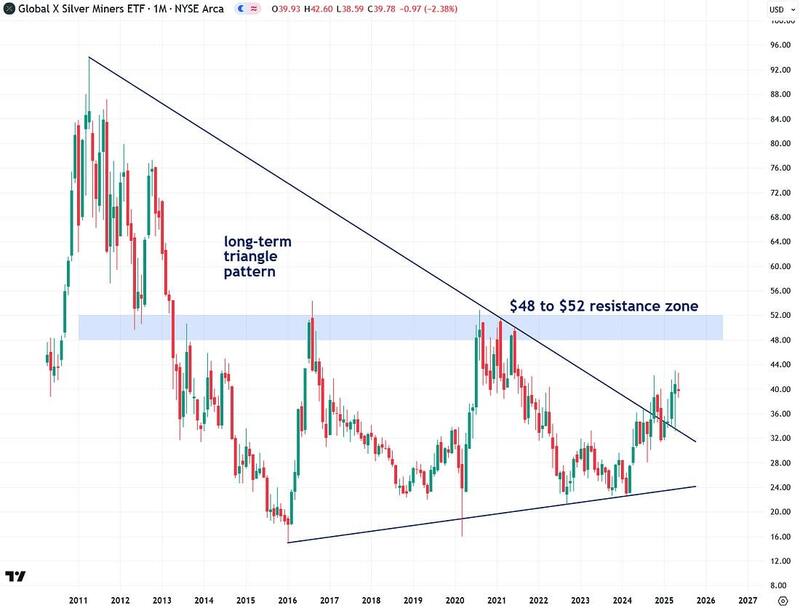
I’m also anticipating a strong bull market in silver mining stocks and am closely watching the Global X Silver Miners ETF (SIL) for signals.
A few months ago, SIL broke out of a long-term triangle pattern dating back to 2011, and a decisive close above the $48 to $52 resistance zone would provide further confirmation that the bull market is underway.
I believe this move will coincide with a breakout in the COPX copper miners ETF as well. Silver mining stocks, in my view, represent one of the most compelling and potentially profitable opportunities in the next leg of the commodities bull market.
Moving on, I often track and share a custom indicator I developed—the Synthetic Silver Price Index (SSPI)—to help validate and analyze silver’s price trends with greater clarity.
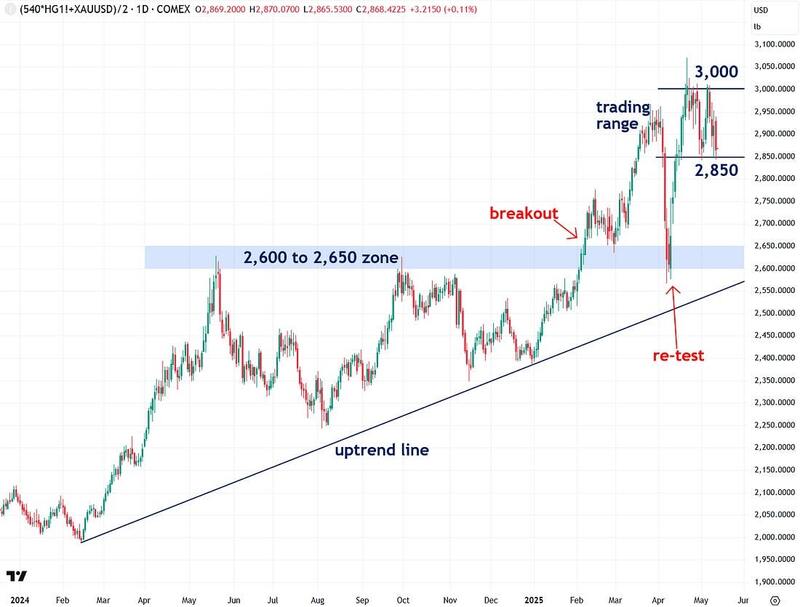
The SSPI averages the prices of gold and copper, with copper weighted by a factor of 540 to ensure gold doesn’t dominate the calculation. Interestingly, despite silver not being an input, the SSPI has shown a remarkably strong correlation with silver’s price—making it a valuable tool for cross-verifying trends and potential breakouts.
For much of the past year, the 2,600 to 2,650 zone has served as a key resistance level for the SSPI. I’ve maintained that a breakout above this range would signal a bullish shift for both the SSPI and silver.
Although the “Liberation Day” market shock triggered a sharp drop, the SSPI found solid support right at this critical zone and has since rebounded strongly. It’s now trading in a range between 2,850 and 3,000. A breakout from this range—ideally to the upside—would offer another meaningful signal for silver’s direction.
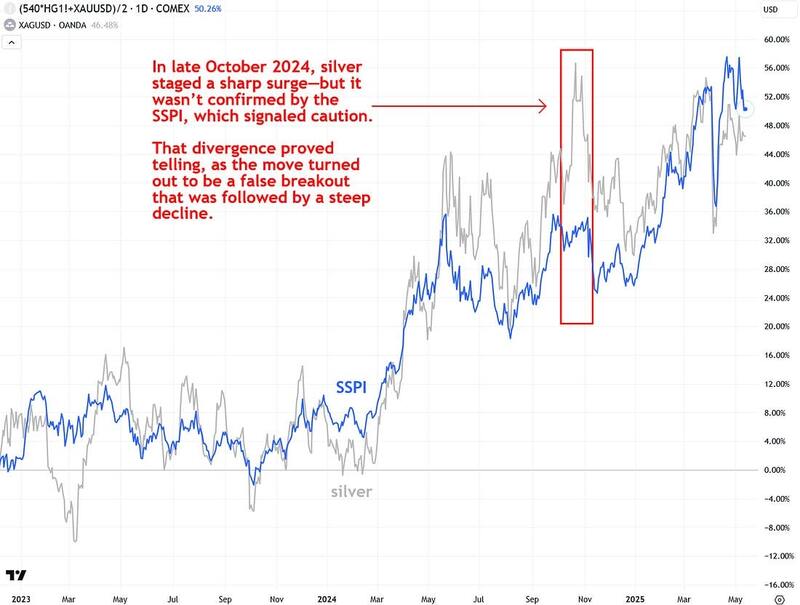
I’ve often pointed out that the Synthetic Silver Price Index (SSPI) and the price of silver are highly correlated—with a five-year correlation coefficient of 0.842 on a scale from -1 to 1.
Now I want to show you the chart so you can see that close relationship for yourself.
What’s especially remarkable is that the SSPI is calculated solely from the average prices of gold and copper—silver itself isn’t even included—yet the correlation remains incredibly strong. This underscores silver’s unique nature as both a precious metal and an industrial metal.
I use the SSPI as a tool to confirm—or question—moves in silver. When silver diverges significantly from the SSPI, it often signals that something unusual is going on with silver.
For instance, if the SSPI is surging while silver remains flat, that indicates likely price suppression in silver. Conversely, if silver appears to be breaking out but the SSPI doesn’t reflect a similar move, it increases the likelihood of a false breakout in silver—and that’s precisely what happened in late October 2024.
In both scenarios, the SSPI serves as a valuable reality check for silver’s price action. Ideally, I want to see both moving in tandem to confirm the validity of a trend, and at the moment, they are trading largely in sync.
Throughout this article, I’ve emphasized that silver is a hybrid metal—part industrial, part precious—with its industrial demand significantly outweighing its investment demand.
Because of this, silver’s price is highly sensitive to the ups and downs of the economy, often causing it to behave more like a risk asset than the traditional safe-haven role people typically expect.
As the pie chart below shows, the majority of silver demand—about 55%—comes from industrial use, while only around 20% comes from investment.
In contrast, gold demand is driven largely by investment (44.57%) and jewelry (48.74%), with much of that jewelry serving as a form of investment as well, particularly in developing countries like India and China.
As I mentioned earlier, I’m a long-term bull on copper and expect a powerful bull market in the years ahead for both technical and fundamental reasons. From a technical analysis perspective, the ascending triangle pattern I highlighted earlier points to a strong bull market.
Fundamentally, the outlook is equally compelling—copper plays a vital role in clean energy technologies, from electric vehicles to renewable power infrastructure. Goldman Sachs even referred to copper as “the new oil” because of its central importance in the energy transition.
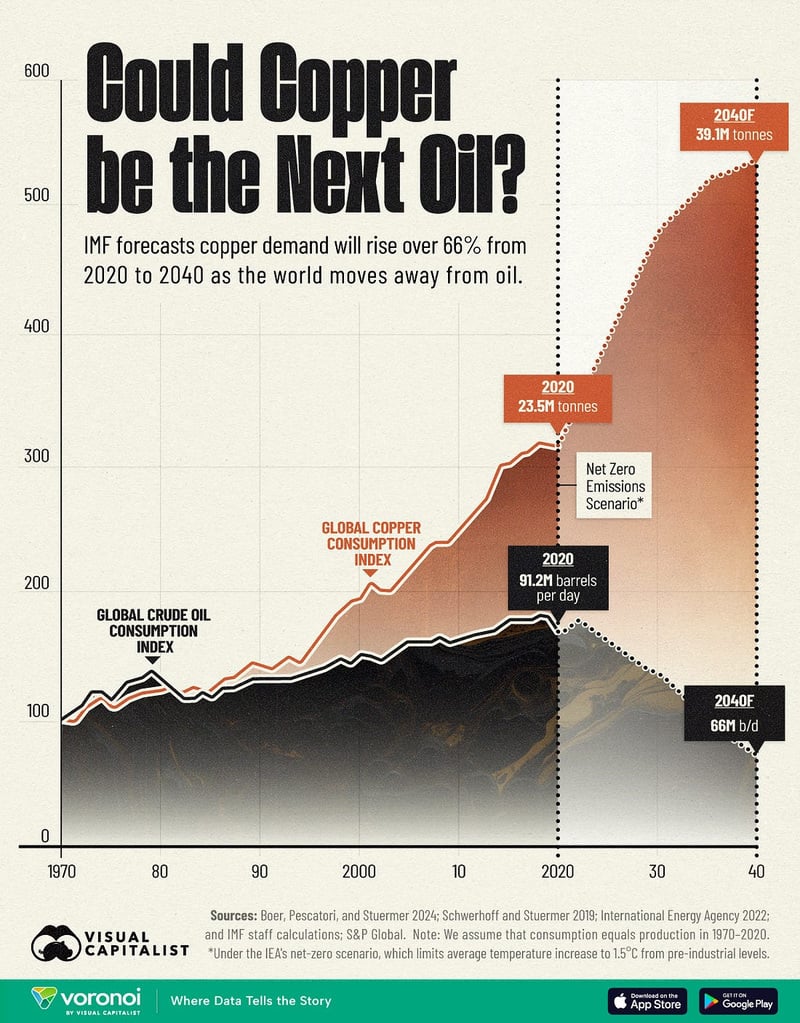
Supporting this view, Visual Capitalist—well known for its economic infographics—recently published a striking infographic titled “Could Copper Be the Next Oil?”
In 2023, the IMF projected a 66% increase in copper demand from 2020 to 2040 as the global shift away from oil gains momentum. The infographic highlights how copper demand is expected to rise significantly in the coming decades, while oil consumption is predicted to decline.
Copper plays a vital role in numerous applications, including the electrical grid, electric vehicles (EVs), and renewable energy technologies. In addition to its importance in clean energy, copper is widely used in sectors such as construction, infrastructure, and defense, thanks to its exceptional properties. Under a net-zero emissions scenario aimed at limiting global temperature increases to 1.5°C above pre-industrial levels, global copper demand is expected to rise significantly, from 25.9 million tonnes in 2023 to 39.1 million tonnes by 2040.
A significant portion of this growth is anticipated to come from the electric vehicle industry, where copper is a critical component. Battery electric vehicles, on average, contain 60-83 kilograms of copper—four times the amount used in internal combustion engine vehicles, which typically require only 15-20 kilograms of copper per car.
In contrast, oil consumption is projected to decline significantly, falling from 101.9 million barrels per day in 2023 to 66 million barrels per day by 2040. This decrease is fueled by global efforts to cut carbon emissions, the rapid adoption of renewable energy, and advancements in energy efficiency. Stricter policy regulations are also playing a key role in reducing oil demand.
Last year, French billionaire and commodities trader Pierre Andurand predicted that copper prices could soar to $40,000 per tonne in the coming years—a more than fourfold increase from the current price of $9,485 per tonne.
“We are moving towards a doubling of demand growth for copper due to the electrification of the world, including electric vehicles, solar panels, wind farms, but also military usage and data centres,” he told the Financial Times.
Next, let’s look at the U.S. Dollar Index—a measure of the dollar’s exchange rate against a basket of major world currencies (not its domestic purchasing power)—because it has a strong influence on commodity prices, including copper, silver, and gold.
The dollar and commodities typically trade inversely, meaning that a stronger dollar tends to weigh on commodity prices, while a weaker dollar generally supports them.
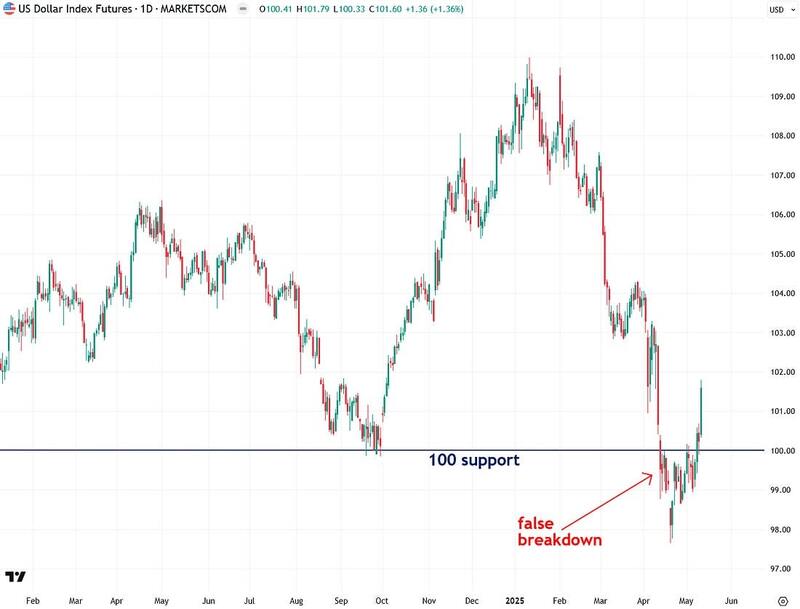
In recent weeks, I’ve been highlighting how the U.S. Dollar Index broke below the key 100 support level—a level that had held for the past couple of years—and I’ve been watching closely to see if that breakdown would hold and lead to further downside.
Interestingly, it turned out to be a false breakdown, as the index has since climbed back above the 100 mark in recent days, buoyed by optimism around new trade deals—particularly with China—under the Trump administration.
While I maintain a longer-term bearish outlook on the dollar, as I’ll explain shortly, I always respect price action and avoid fighting the market. For now, momentum is to the upside in the dollar, which, all else being equal, creates a headwind for commodities—though they’ve been holding up surprisingly well so far.
Now, after all this discussion of assets correlated with silver, let’s take a look at silver itself.
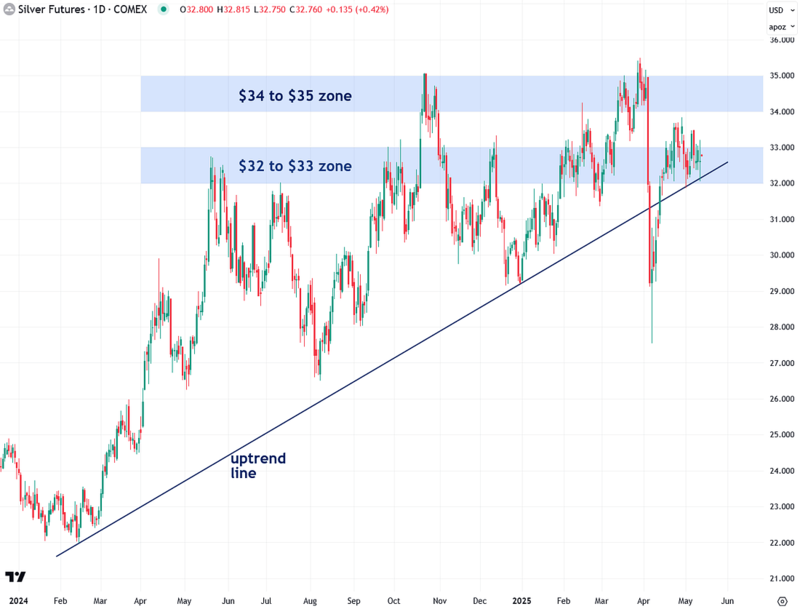
As the chart below shows, COMEX silver futures have remained steady in recent weeks, consolidating in the $32 to $33 range while holding above a key uptrend line—a positive sign.
To confirm that the next leg of silver’s bull market is underway, I’d like to see a decisive breakout above both the $32–$33 resistance zone and the $34–$35 resistance zone. For now, it’s a waiting game.
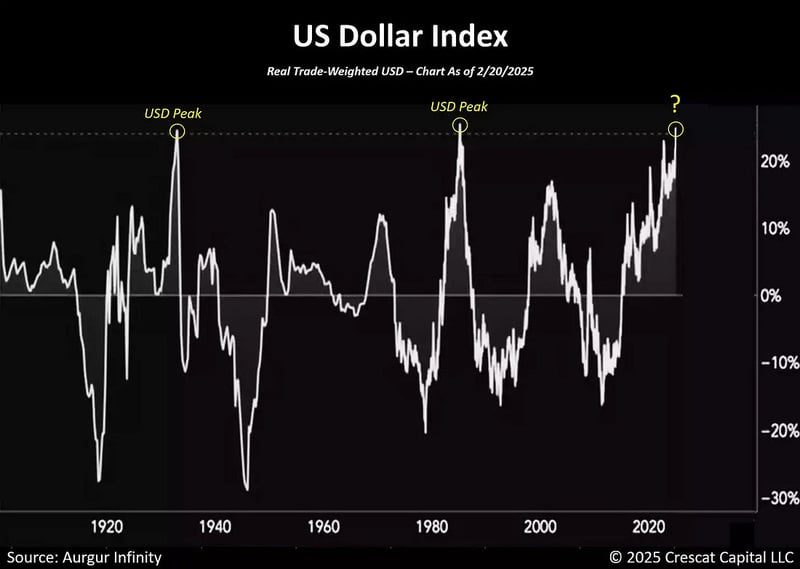
Although the U.S. Dollar Index is experiencing a short-term bounce, I don’t believe the move has much staying power. I remain firmly bearish on the dollar over the long term relative to other major currencies.
One key reason is that, based on over 120 years of historical data, the dollar is now more overvalued than at nearly any other point—except 1933 and 1985, both of which were followed by substantial declines.
I believe that when the dollar eventually corrects and mean reverts, it will ignite a powerful bullish surge across the commodities sector—including copper, gold, silver, and mining stocks.
There are strong parallels between today’s setup and the early 2000s, when an overvalued dollar during the dot-com bubble entered a prolonged bear market. That decline helped launch a commodities supercycle that lasted until around 2012. I see a similar pattern unfolding again this time around.
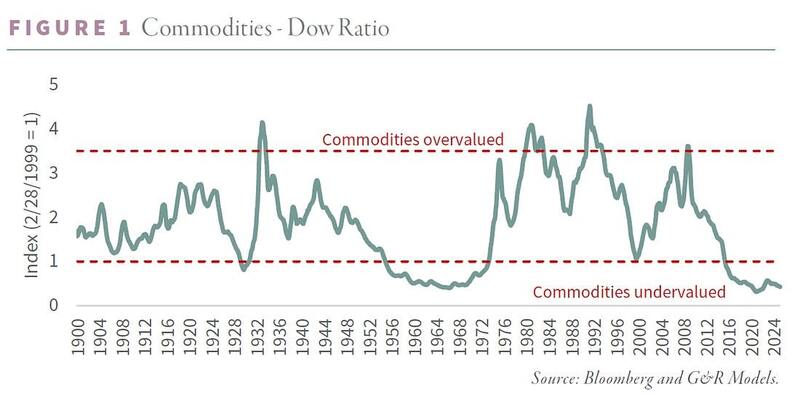
Further confirmation that a new commodities supercycle is ahead comes from the commodities-to-Dow ratio, which shows commodities are deeply undervalued relative to stocks—at levels historically seen before major commodity bull markets and prolonged periods of stock market stagnation.
This indicates an impending capital rotation, with investment shifting away from equities and into hard assets and natural resources.
To summarize, I closely monitor copper as an indicator for silver, given their strong correlation. In the short term, both metals are consolidating and catching their breath after a dramatic, tariff-driven plunge and rebound over the past month.
However, the longer-term outlook remains bullish, supported by copper’s ascending triangle formation that indicates significantly higher prices ahead, along with strong fundamentals tied to the metal’s vital role in clean energy technologies.
As an investor, I’m enthusiastic about the opportunities in both silver and copper mining stocks and intend to capitalize on that potential. For now, though, I’m watching to see how both metals break out from their current consolidation patterns.
If you found this report valuable, click here to subscribe to The Bubble Bubble Report for more content like it.
Jesse Colombo is a financial analyst and investor writing on macro-economics and precious metals markets. Recognized by The Times of London, he has built a reputation for warning about economic bubbles and future financial crises. An advocate for free markets and sound money, Colombo was also named one of LinkedIn’s Top Voices in Economy & Finance. His Substack can be accessed here.
(Mike Maharrey, Money Metals News Service) The federal government ran a big budget surplus in April, but don’t get too excited. Uncle Sam hasn’t solved its spending problem.
In fact, it’s getting worse.
The U.S. government typically runs a surplus in April with the surge of tax receipts. This year, federal receipts got a further boost thanks to an influx of tariff money.
According to the latest monthly Treasury statement, the government took in $258.4 billion more than it spent in April.
Federal tax receipts came in at $850.17 billion in April. That was more than double March’s federal revenue of $367.65 billion and a 9.53 percent increase from April 2024.
Net customs duties were up about $9 billion compared to one year ago. Through the first seven months of fiscal 2025 (beginning Oct. 1), net customs duties totaled $63 billion. That compares with $48 billion in the same period a year earlier.
While this windfall helped paper over the federal budget problem, tariff revenue will likely fall off as Trump negotiates trade deals to lower duties and markets adjust to the higher taxes. Plans to implement additional tax cuts being tossed around D.C. would also put a strain on federal receipts.
Meanwhile, the real problem has been, and continues to be, unrestrained government spending.
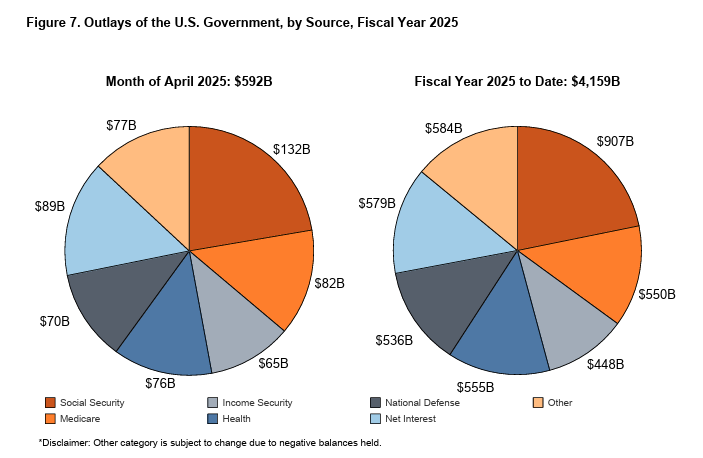
The Trump administration blew through $591.77 billion in April. That was 4.4 percent higher than April 2024’s spending. At $4.16 trillion, spending is up 8.9 percent through the first seven months of fiscal 2025.
The fiscal year budget deficit currently stands at $1.05 trillion. That’s 22.8 percent higher than through the same period in fiscal 2024.
You might recall that President Biden promised that the [pretend] spending cuts would save “hundreds of billions” with the debt ceiling deal (aka the [misnamed] Fiscal Responsibility Act).
That never happened.
And despite headlines touting the success of DOGE, it appears the Republicans aren’t going to do any better. Furthermore, a spending plan being kicked around by Congress would increase the deficit by some $6 trillion over the next decade.
The truth is that the federal government always manages to find new reasons to spend money, whether for natural disasters at home or wars overseas. The Biden administration blew through a staggering $6.75 trillion in fiscal 2024, a 10 percent increase over 2023 outlays.
Interest on the national debt cost $101.7 billion in April. That brought the total interest expense for the fiscal year to $684.1 billion, up 9.5 percent over the same period in 2024.
So far, in fiscal 2025, the federal government has spent more on interest on the debt than it has on national defense ($536 billion) or Medicare ($550 billion). The only higher spending category is Social Security ($907 billion).
Uncle Sam paid $1.13 trillion in interest expenses in fiscal 2023. It was the first time interest expense had ever eclipsed $1 trillion. Projections are for interest expense to break that record in fiscal 2025.
Much of the debt currently on the books was financed at very low rates before the Federal Reserve started its hiking cycle. Every month, some of that super-low-yielding paper matures and has to be replaced by bonds yielding much higher rates. And even with the recent Federal Reserve rate cuts, Treasury yields have pushed upward as demand for U.S. debt sags.
This is one of the reasons everybody is clamoring for interest rate cuts.
These big deficits pile onto a national debt that officially topped $36 trillion in November. Currently, the debt level is steady because the federal government is up against the debt ceiling. However, you can expect a huge surge in debt once Congress raises the ceiling. (And it will raise the ceiling.)
Some people claim that borrowing, spending, and big national debts don’t matter.
They do.
According to the national debt clock, the current debt level represents 122.81 percent of the GDP. Studies have shown a debt-to-GDP ratio of over 90 percent retards economic growth by about 30 percent.
“Confidence in U.S. creditworthiness may be undermined by a rapidly deteriorating fiscal situation, an increasing concern with federal debt set to grow substantially in the coming years.”
This could lead to lower economic growth, higher unemployment, and less investment wealth.
Lack of confidence in the U.S. fiscal situation could also lower demand for U.S. debt. This would force interest rates on U.S. Treasuries even higher to attract investors, exacerbating the interest payment problem. As already mentioned, we saw a big spike in Treasury yields despite Fed rate cuts.
Biden ran the debt higher at a dizzying pace, but to be fair, this isn’t just a Biden problem. Every president since Calvin Coolidge has left the U.S. with a bigger national debt than when he took office.
It’s going to take more than DOGE rooting out waste to get the borrowing and spending under control. Even if the Trump administration manages to slash discretionary outlays as promised, that only accounts for 27 percent of total spending. The vast majority is for entitlements, and there is little political will to take the scissors to Social Security or Medicare.
And the sad fact is that most people in positions of power are content to kick the debt can down the road. They reason, ‘Nothing has happened yet, so why worry?’ But the problem with playing kick the can down the road is that you eventually run out of road.
Mike Maharrey is a journalist and market analyst for Money Metals with over a decade of experience in precious metals. He holds a BS in accounting from the University of Kentucky and a BA in journalism from the University of South Florida.
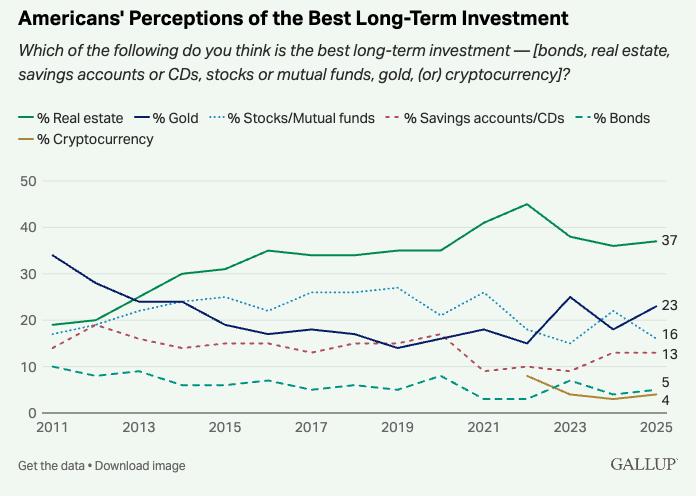
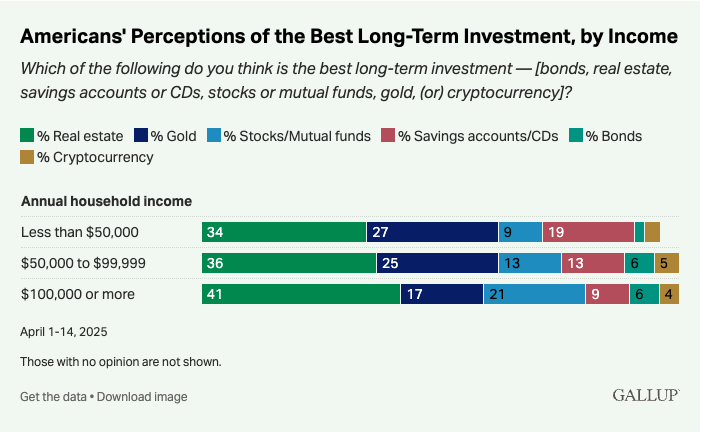
According to the latest Gallup poll, gold has overtaken stocks and is now viewed as the second-best long-term investment in America, trailing only real estate.
In the latest survey, 23 percent of the respondents chose gold as the best long-term investment. That was up five points from last year’s poll.
Thirty-seven percent of the respondents chose real estate as the best investment. That was virtually unchanged from a year ago.
Real estate has ranked as the top investment for Americans each year since 2014, with between 30 percent and 45 percent selecting it.
The number of Americans choosing stocks as the top investment fell 6 percentage points to 16 percent.
Thirteen percent of Americans chose savings accounts or CDs as the best option for long-term returns, 5 percent picked bonds, and 4 percent said they prefer cryptocurrency. Those numbers were all in line with last year’s readings.
Gallup said the poll was mostly conducted after President Trump announced sweeping tariffs last month, sparking a sharp stock market selloff. Even with a pause on some tariffs and apparent progress in negotiating trade deals, stock market volatility has remained high.
Gold’s appeal still hasn’t reached the popularity it enjoyed in 2011 at the height of the Great Recession and aggressive quantitative easing (money creation) by the Federal Reserve, when 34 percent of Americans polled chose it as the top asset.
According to Gallup, there is a notable difference in investment preferences between income groups, with higher earners preferring riskier investments such as stocks, and lower-income groups choosing the perceived safer options such as gold and cash.
Twenty-seven percent of respondents making less than $50,000 chose gold. That percentage fell to 17 percent for those earning $100,000 or more.
This could explain why, despite the professed preference for gold, American investors have largely been absent from the recent gold rally. Investors in the East – particularly China – have primarily driven this gold bull run.
China reported the second strongest quarter for gold coin and bar demand on record in Q1. Demand for gold is so strong in China that the government recently allocated additional gold import quotas for commercial banks last month.
Meanwhile, in the U.S., gold coin and bar demand dropped to the lowest level in almost five years.
According to a survey by Retirement Living, just over 10 percent of Americans own gold. According to the Gallup survey, 62 percent of Americans report owning stocks, either separately or through a mutual fund or 401(k).
Mike Maharrey is a journalist and market analyst for Money Metals with over a decade of experience in precious metals. He holds a BS in accounting from the University of Kentucky and a BA in journalism from the University of South Florida.
“We are destroying more and more homes, and Gazans have nowhere to return to. The only inevitable outcome will be the wish of Gazans to emigrate outside of the Gaza Strip,” Netanyahu said at the Knesset’s Foreign Affairs and Defense Committee, according to The Jerusalem Post.
Israeli officials have made clear that the ethnic cleansing of the Palestinian population of Gaza is their ultimate goal, but it remains unclear where the Palestinians would go. Netanyahu told the committee that the “main problem” preventing “emigration” is the lack of countries willing to take in the Palestinians.
Israel has maintained a total blockade on Gaza since March 2 and has developed plans to start bringing in aid using private US security contractors to use food to lure starving Palestinians into a tiny part of southern Gaza. Netanyahu said that the aid would be conditional on the Palestinians not returning to where they came from.
Limor Son Har-Melech, an Israeli MK and member of the Jewish Power Party, suggested American Jews could move to Gaza. “Bring the Jews from the United States, this way we’ll hit two birds with one stone,” he said.
The US began deploying the B-2s to Diego Garcia in March as President Trump was threatening to bomb Iran and was carrying out heavy airstrikes in Yemen. Trump also deployed an additional aircraft carrier to the Middle East, a second THAAD missile defense system to Israel, and other air assets to the region.
Between March 15 and May 6, the US launched over 1,000 strikes on Yemen, killing over 200 civilians. According to Fox News reporter Jennifer Griffin, the US used the B-2 bombers it deployed to Diego Garcia for some of the attacks.
Tensions in the region have cooled since Trump ended his bombing campaign in Yemen, and the US has held several rounds of talks with Iran.
But the US is maintaining its additional force posture in the region, and Trump administration officials have still been threatening an attack on Iran if negotiations to reach a nuclear deal fail, even though there’s no evidence Tehran is working toward a nuclear weapon.
Satellite images have shown that in recent days, four B-52 bombers and at least six B-2s have been deployed to the base. The US officials speaking to Reuters said the B-52s were there to replace the B-2s.
The main difference between the two aircraft is the B-2’s stealth ability. Both bombers can carry the heaviest bombs in the US arsenal, including nuclear weapons.
(Headline USA) A man accused of fatally shooting two people and wounding six others during a shooting last month at Florida State University was discharged from a Tallahassee hospital on Monday and charged with murder, authorities said.
Phoenix Ikner, 20, was booked into the Leon County Detention Facility on two counts of first-degree murder and seven counts of attempted first-degree murder, the Leon County Sheriff’s Office said in a statement. He was then transferred to a jail in neighboring Wakulla County, which is standard procedure when an inmate is related to a Leon County deputy.
Ikner, identified as the stepson of a sheriff’s deputy, arrived on campus April 17 and stayed near a parking garage before he walked in and out of buildings and green spaces while firing a handgun just before lunchtime, police said.
In roughly four minutes, officers confronted Ikner, a political science student at Florida State, and shot and wounded him, Tallahassee police said.
Police believe Ikner used a former service weapon that belongs to his stepmother, an 18-year veteran of the Leon County Sheriff’s Office, officials said. In recent years, she has worked as a middle school resource officer and was the department’s employee of the month a year ago in March. After the shooting she requested and was granted personal leave and also reassigned from her post at the school.
Authorities have not yet revealed a motive for the shooting.
Online jail and court records Monday didn’t list an attorney for Ikner. Multiple attempts to reach his family after the shooting went unanswered.
(Headline USA) UnitedHealth CEO Andrew Witty is stepping down for personal reasons and the nation’s largest health insurer suspended its full-year financial outlook due to higher-than-expected medical costs.
Chairman Stephen Hemsley will become CEO, effective immediately, the Minnesota company said.
Hemsley was UnitedHealth Group CEO from 2006 to 2017. He will remain chairman of the company’s board. Witty will serve as a senior adviser to Hemsley.
— Ken Klippenstein (@kenklippenstein) May 13, 2025
It has been a punishing period for UnitedHealth, starting in December when executive Brian Thompson was targeted outside of a New York City hotel and killed. While unrelated to the financial operations of the $340 billion healthcare giant, its shares have tumbled severely since the attack.
“I’m deeply disappointed in and apologize for the performance setbacks we have encountered from both external and internal challenges,” Hemsley said during an early Tuesday conference call.
“Many of the issues standing in the way of achieving our goals as well as our opportunities are largely within our control. I am optimistic about our future as these issues are within our capacity to resolve. We will approach them with humility, rigor and urgency.”
The 60 year-old Witty joined the company in 2018 after serving about nine years as CEO of the British drugmaker GlaxoSmithKline. He was named UnitedHealth’s CEO in February 2021, replacing Dave Wichmann.
UnitedHealth became one of the nation’s largest companies under Witty’s leadership. Total revenue topped $400 billion last year, a 55% increase from the $257 billion UnitedHealth brought in the year before Witty became CEO.
Shares of UnitedHealth rocketed higher under Witty, too, up 60.5% since he took the company’s top job.
Yet there have been several setbacks for UnitedHealth over the past five months as it wrestles with the national attention on Luigi Mangione, who was indicted last month on a federal murder charge in the killing of Thompson.
The case has captured the American imagination, setting off a cascade of resentment and online vitriol toward U.S. health insurers while rattling corporate executives concerned about security.
UnitedHealth cut its 2025 forecast last month following its first quarterly earnings miss in more than a decade. On Tuesday the company withdrew that financial forecast entirely, saying that medical costs from new Medicare Advantage members were higher than expected.
Shares of UnitedHealth, which have plummeted 38% since the deadly Dec. 4 ambush of Thompson in midtown Manhattan, fell more than 12% at the opening bell.
More than 50 million people have health insurance under UnitedHealth Group Inc. It also has a large pharmacy benefit manager that runs prescription drug coverage and a growing Optum segment that delivers care and provides technical support.
UnitedHealthcare is the nation’s largest provider of Medicare Advantage plans, with more than 8 million customers. Those are privately run versions of the federal government coverage program mostly for people ages 65 and older.