
(Mike Maharrey, Money Metals News Service) The November CPI data came in much cooler than expected. This boosted optimism that the Federal Reserve has finally gotten inflation under control and fueled speculation that the Federal Reserve may be willing to deliver additional monetary easing (In other words, create more inflation).
The question should be: why is anybody putting any stock in this CPI report at all? The Bureau of Labor Statistics (BLS) basically made the data up.
We knew that the data was suspect, given that the BLS didn’t collect data for October due to the government shutdown. Reading through the BLS notes, we get some idea of how the agency parsed the data. It doesn’t exactly increase confidence in the report’s veracity.
In the CPI report summary, the BLS offers a quick overview of how it handled the mass of missing October data.
“BLS did not collect survey data for October 2025 due to a lapse in appropriations. BLS was unable to retroactively collect these data. For a few indexes, BLS uses nonsurvey data sources instead of survey data to make the index calculations. BLS was able to retroactively acquire most of the nonsurvey data for October. CPI data collection resumed on November 14, 2025.”
The BLS also released a separate note titled “2025 federal government shutdown impact on the Consumer Price Data.” It explains, “What was the impact on November data collection?”
“Collection began on Friday, November 14. By authorizing additional collection hours, BLS attempted to collect data for the entire month of November.”
Note the key word – “attempted.”
The BLS goes on to further explain this “attempt.”
“How were November indexes calculated? November 2025 indexes were calculated by comparing November 2025 prices with October 2025 prices.”
Umm… wait a minute. There wasn’t any October data. What is a government number-cruncher to do?
“BLS could not collect October 2025 reference period survey data, so survey data were carried forward to October 2025 from September 2025 in accordance with normal procedures.”
In other words, they just pretended October prices were the same as September prices and went on their merry little way.
Or to put it more bluntly, they just made up the October data. If we’re being generous, we can call it an educated guess. But a guess, nonetheless.
Wolf Richter at WolfStreet called it “a bad joke.”
And he also pointed out that the BLS carried over some hinky September data into the November CPI report.
In September, there was an unexpected and unexplained drop in Owner’s Equivalent Rent (OER). This is a key metric the BLS uses to calculate the cost of home ownership. It is a stand-in for expenses such as homeowner’s insurance, HOA fees, property taxes, and maintenance. OER is based on the following question in the Consumer Expenditure Survey posed to people who own their primary residence: “If someone were to rent your home today, how much do you think it would rent for monthly, unfurnished and without utilities?”
So, OER is always, at best, just an educated guess based on a survey.
This guess accounts for 26 percent of overall CPI, for 33 percent of core CPI, and for 44 percent of core services CPI.
In September, Owner’s Equivalent Rent charted a massive outlier, rising by only 0.13 percent. That compared to a .38 percent increase in August and a 12-month range between 0.27 and 0.41 percent.
Simply put, this sudden outlier plunge doesn’t make any sense. It doesn’t take a PhD in economics to recognize that the rapidly rising cost of homeownership didn’t suddenly stop rising in September.
WolfStreet explains how this was carried over into October and November.
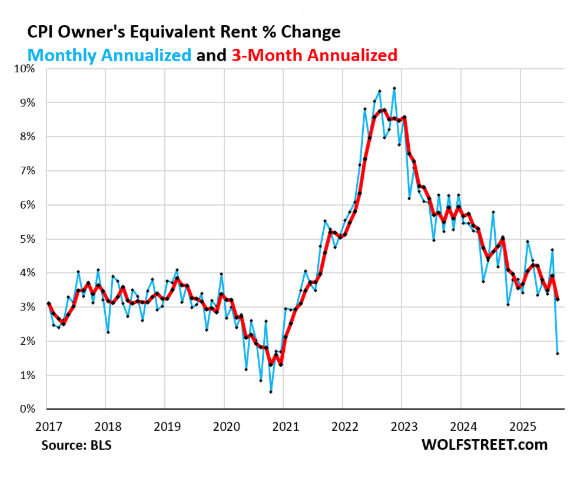
“[OER] has been at an annualized rate of 1.6 percent for the past three months, compared to an average 4.1 percent in the six months before the doctored September. That’s a sudden 2.4 percentage-point plunge out of nowhere for the third month in a row.”
Therefore, as WolfStreet notes, the November CPI would have been much hotter had it not been for this outlier being carried forward into the new data.
“The September data, which was used as base for the made-up October data, was marred by the total outlier plunge of OER… And that outlier plunge in September was carried forward to October and November.”
This really isn’t shocking. The government has a solid track record of providing bad data. Remember all of those revisions to the employment data? The problem is that this data is implicated in all kinds of decisions. The Federal Reserve uses it to guide monetary policy. CPI data is used to calculate real GDP and real consumer spending. It is used to determine cost-of-living adjustments to Social Security and other government programs.
You should always take government data with a grain of salt, but this CPI report needs an entire shaker. When government people point to this data to claim they won the inflation fight and to justify further rate cuts, remember, they are leaning on the punchline of a bad joke to make their case.