
(Jesse Colombo, Money Metals News Service) Both gold and silver are undergoing healthy consolidation phases after their strong rallies, allowing them to reset and work off overbought conditions.
It’s time for an updated look at where things stand. Three weeks ago, I suggested that gold may have temporarily peaked after a strong rally, and that a period of sideways movement or a minor pullback would be both healthy and necessary to cool off its overbought condition.
That’s exactly what we’ve seen since—gold has moved sideways, consolidating its gains. Here’s what I’m seeing now and what I believe is likely to happen next.
For technical analysis purposes, I prefer to focus on COMEX gold futures rather than spot prices, as futures tend to respect and form support and resistance levels in clean $100 increments—such as $3,000, $3,100, $3,200, and so on.
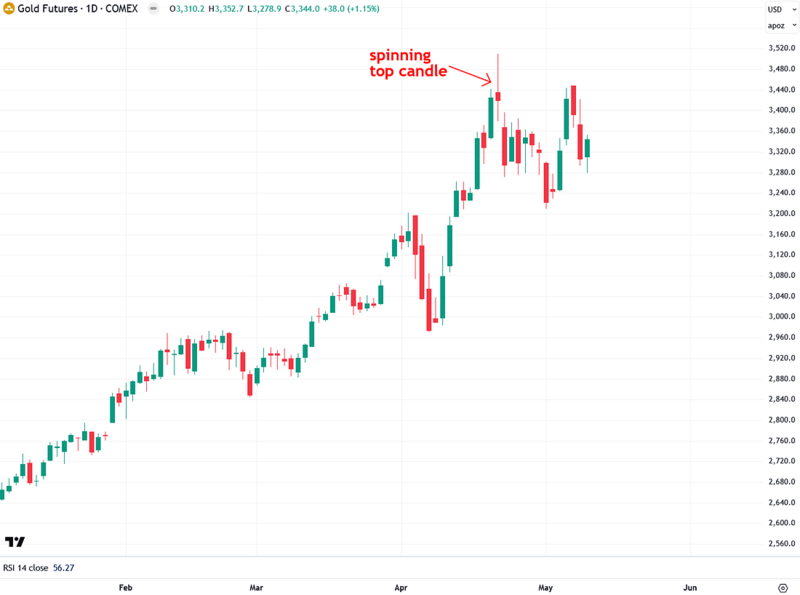
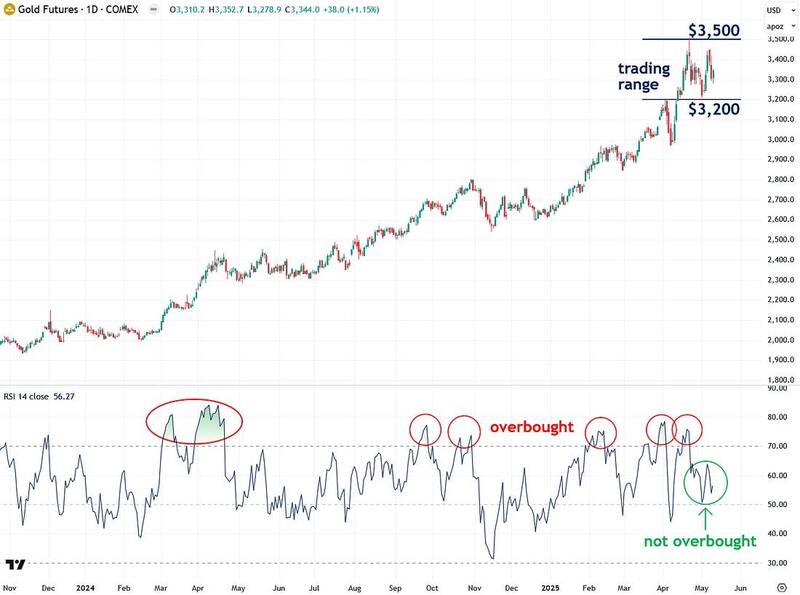
Since peaking on April 22nd, when gold briefly tested $3,500 before pulling back, futures have been consolidating in a range between $3,200 and $3,500.
This type of sideways action is common in strong bull markets and often serves as a launchpad for the next leg higher.
I’m currently watching for a breakout scenario, which would be confirmed by a decisive close above $3,500 on strong volume. If that occurs, I believe gold could surge to $4,000 an ounce fairly quickly—echoing a recent forecast by JP Morgan. I’ll be monitoring this closely.

Back on April 22nd, I pointed out that a candlestick pattern known as a spinning top had formed in gold—a classic sign of indecision that often marks the end of a rally. I suggested that this could signal a temporary peak and the start of a consolidation phase, which is exactly what we’re seeing now.
Interestingly, almost exactly one year ago, a spinning top candlestick appeared around the $2,400 level following gold’s surprise $400 rally (see the chart below)—and that marked the beginning of several months of consolidation before gold broke out again in August 2024.
I see strong parallels between that April 2024 candle and the one we just saw in April 2025.
If this pattern holds, gold is likely to continue moving sideways for a few more months in a healthy pause before making another run higher. I welcome this kind of consolidation—it’s far better for gold to build a solid base than to surge too quickly and risk a sharp correction.

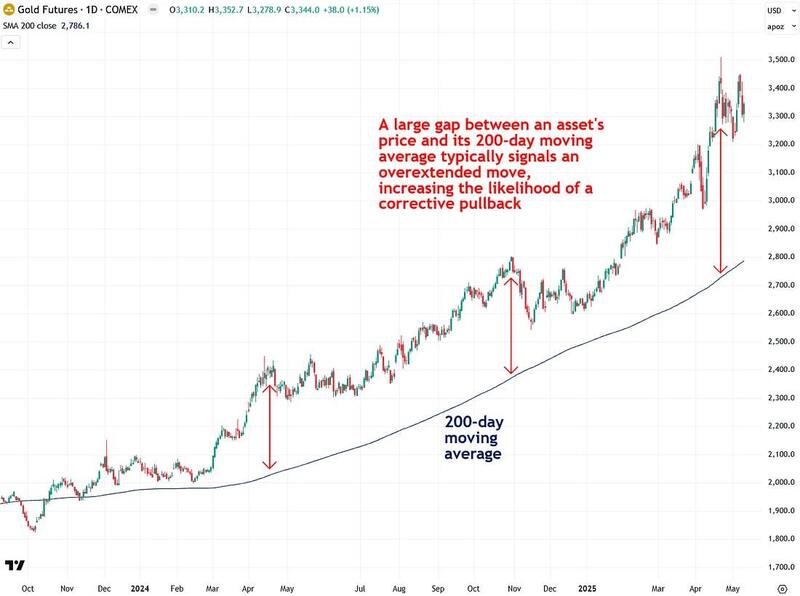
One useful way to gauge whether an asset has surged too far, too fast is by comparing its price to its 200-day moving average.
When an asset becomes significantly stretched above its 200-day moving average, it often signals that a consolidation phase is due—but that doesn’t necessarily mean a sharp pullback. It can take the form of sideways movement as the market digests recent gains.
As the chart below shows, gold became notably extended above its 200-day moving average in April 2024 and October 2024, and in both cases, it entered a healthy consolidation phase to work off those excesses.
The same pattern emerged again in April 2025, so it’s no surprise we’re now seeing gold cool off.
Although we’re already a couple of weeks into this pause, I wouldn’t be surprised if it continues a bit longer until gold and its 200-day moving average converge a bit more.
Another effective way to assess whether an asset like gold has gotten ahead of itself is by looking at the Relative Strength Index (RSI)—a widely used momentum indicator that gauges whether an asset is overbought, oversold, or in neutral territory.
When I published my last update on April 22nd, gold was in overbought territory. Since then, however, the RSI shows that gold has successfully worked off that condition—without requiring a sharp pullback. That’s a very encouraging sign, as it indicates gold is resetting and could soon be in a strong position to resume its rally.
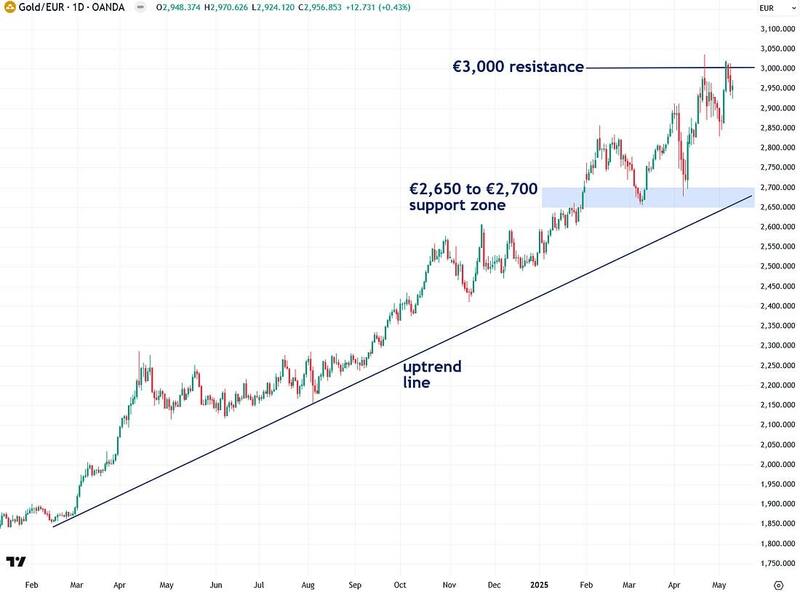
I also like to analyze gold priced in international currencies, as it removes the influence of the U.S. dollar and reveals gold’s true intrinsic strength. One of the key charts I watch is gold priced in euros, and by that measure, the uptrend remains firmly intact. It’s currently hovering just below the critical €3,000 resistance level—a breakout above that would strongly signal the start of gold’s next major rally leg.
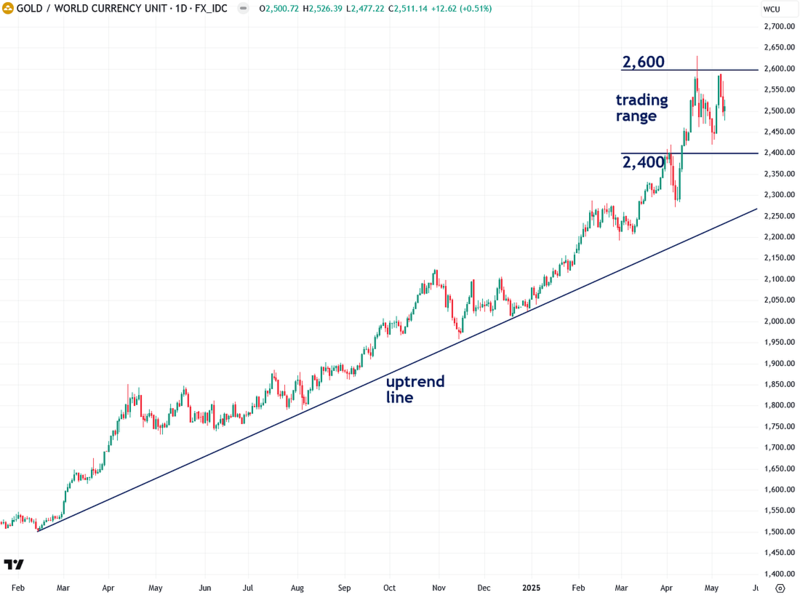
I’ve recently begun tracking gold priced in the World Currency Unit (WCU)—a composite currency based on the GDP-weighted average of the world’s 20 largest economies. In many ways, it offers one of the most balanced and accurate reflections of gold’s true global performance, which is why I’ve been paying close attention to it.
Based on that measure, gold remains in a healthy, confirmed uptrend but has been consolidating in a trading range between 2,400 and 2,600 in recent weeks. Ideally, a breakout above the 2,600 level would signal that gold is ready for its next leg higher.
While I do believe a healthy consolidation in gold is likely in the near term, I strongly disagree with those claiming that gold is at a long-term peak and that the recent highs are as good as it gets.
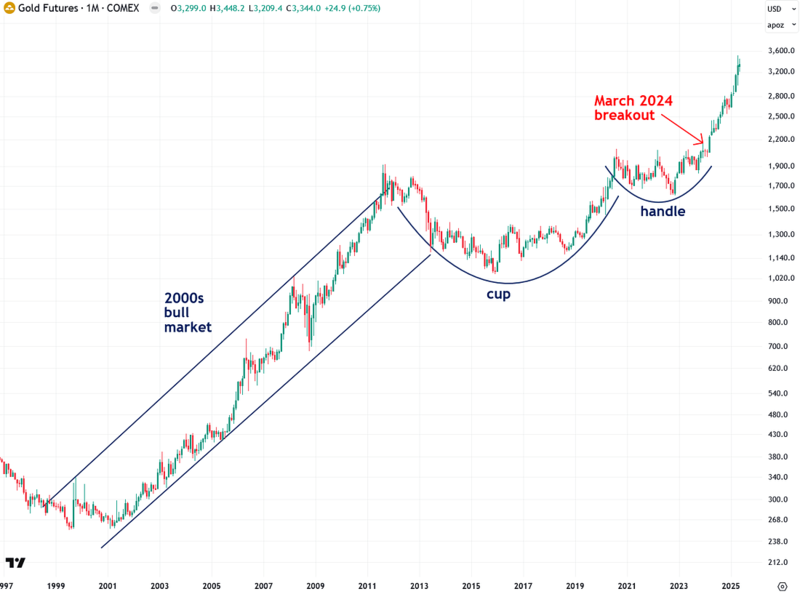
One key reason is that gold broke out of a major cup-and-handle pattern just a year ago (see the chart below)—and historically, breakouts from patterns of that magnitude don’t fizzle out quickly. They typically fuel multi-year bull markets lasting five to ten years or more.
Next, let’s turn to silver, which has been playing second fiddle to gold’s recent surge.
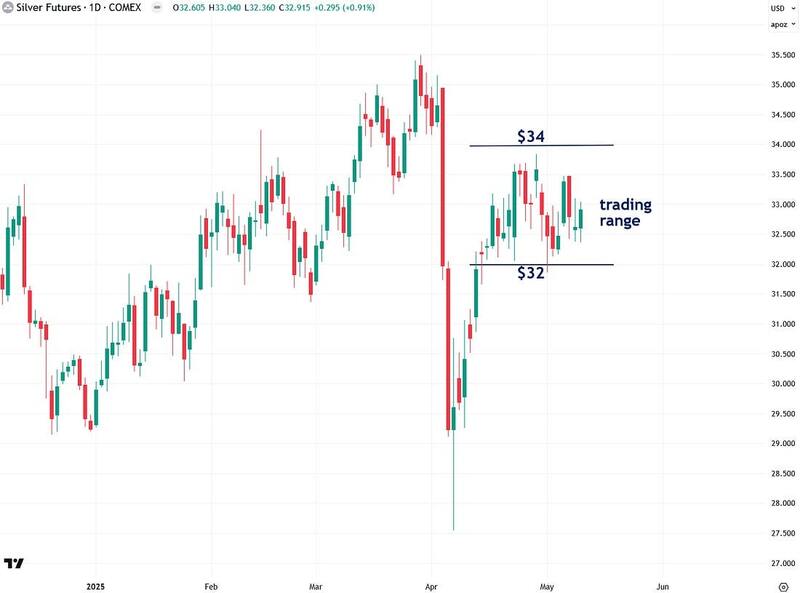
As the chart below shows, COMEX silver futures have remained steady in recent weeks, consolidating in the $32 to $33 range while holding above a key uptrend line—a positive sign.
To confirm that the next leg of silver’s bull market is underway, I’d like to see a decisive breakout above both the $32–$33 resistance zone and the $34–$35 resistance zone. For now, it’s a waiting game.

I also want to highlight something I’m seeing in silver’s short-term price action: a trading range between $32 and $34, which has formed alongside a similar range in gold. I’m closely watching to see which direction these ranges break, as it should offer an important clue about the next major move for both metals.
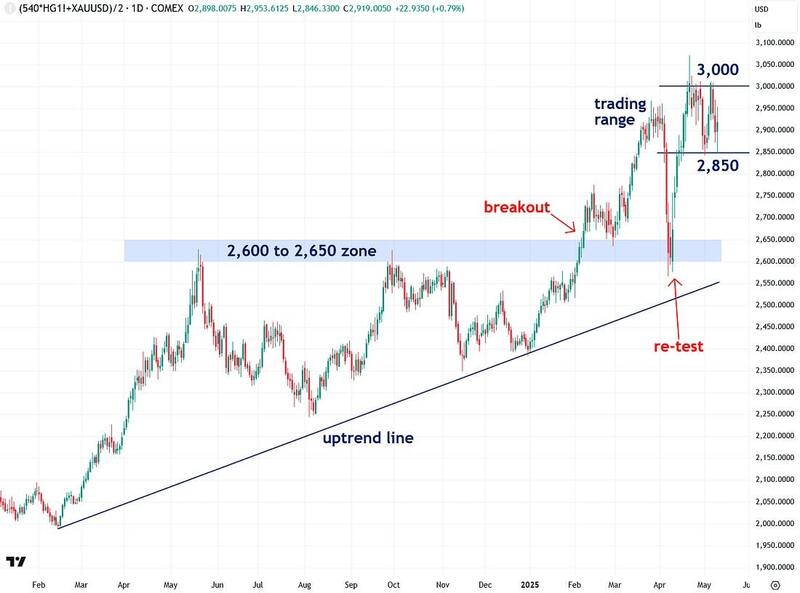
I’ve developed a custom indicator called the Synthetic Silver Price Index (SSPI), designed to help confirm—or challenge—price moves in silver. It’s calculated as the average of gold and copper prices, two metals that exert significant influence on silver. Interestingly, despite silver not being an input, the SSPI has shown a remarkably strong correlation with silver’s price—making it a valuable tool for cross-verifying trends and potential breakouts.
Like silver and gold, the SSPI is currently trading within a range—between 2,850 and 3,000. A breakout from this zone will signal the direction of the next major move and offer valuable insight into where silver is headed next. I’ll be watching it closely.
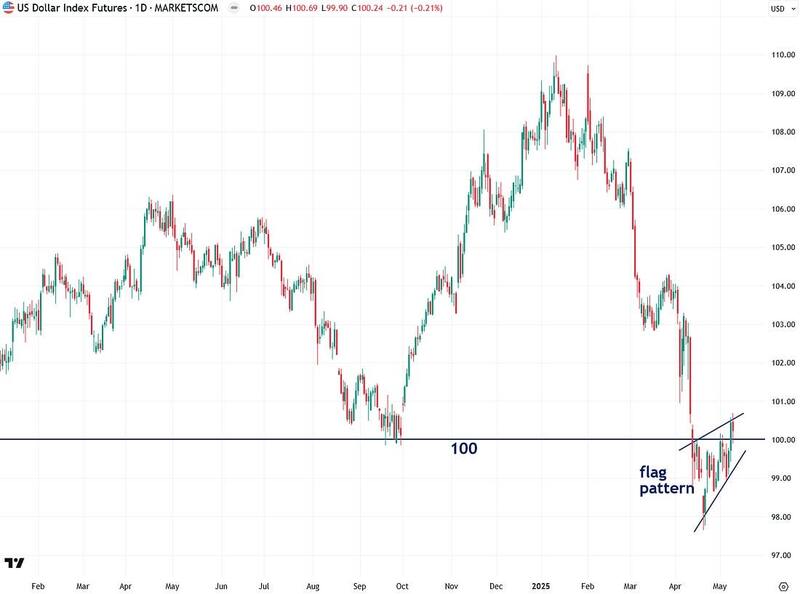
I’m also keeping a close eye on U.S. Dollar Index futures, as I recently explained, because they’re hovering right at the critical 100 level. A decisive breakdown below this key support would signal renewed dollar weakness and fuel further strength in precious metals. On the other hand, a breakout above 100 could create headwinds for metals, given the inverse relationship between the dollar and gold and silver.
On Thursday, U.S. Dollar Index futures briefly popped above the 100 level, but I’m not convinced by the move just yet. The breakout occurred on lackluster volume, and a flag pattern appears to be forming—a breakdown from which would point to further bearish action. I’ll continue monitoring this closely, but for now, the outlook remains inconclusive.
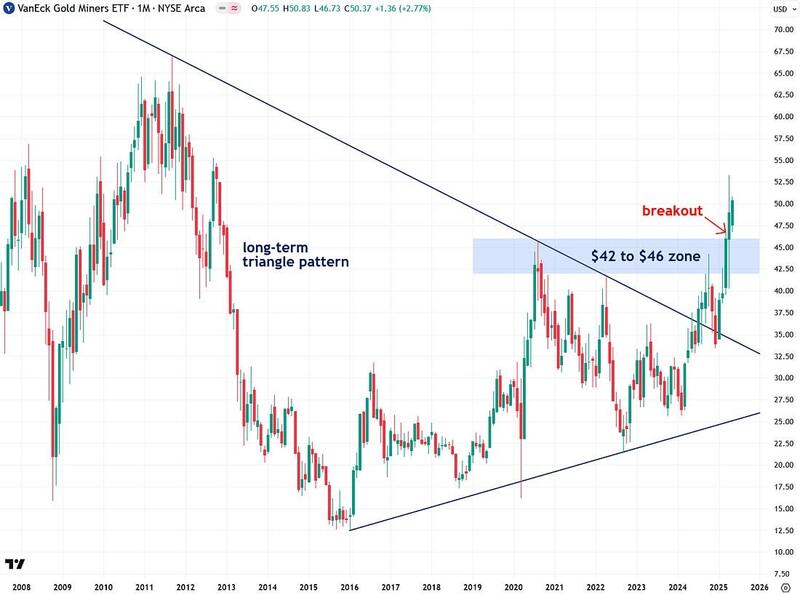
Next, let’s turn to the gold mining sector—starting with the large-cap VanEck Gold Miners ETF (GDX). As I’ve noted in recent updates, GDX recently broke out of a long-term triangle pattern that stretches all the way back to 2011—a major bullish development. However, I also pointed out that a decisive breakout above the key $42–$46 horizontal resistance zone would be needed to fully confirm the move.
That breakout occurred a few weeks ago and remains intact, holding up well despite the recent pause in gold’s price. That’s why I’m launching a new series of in-depth reports detailing my bullish thesis on the gold and silver mining sector—beginning with the first installment, which lays out the long-term bullish case for gold itself. If you haven’t already, I strongly recommend reading it so you’re fully up to speed and ready for what’s coming next.
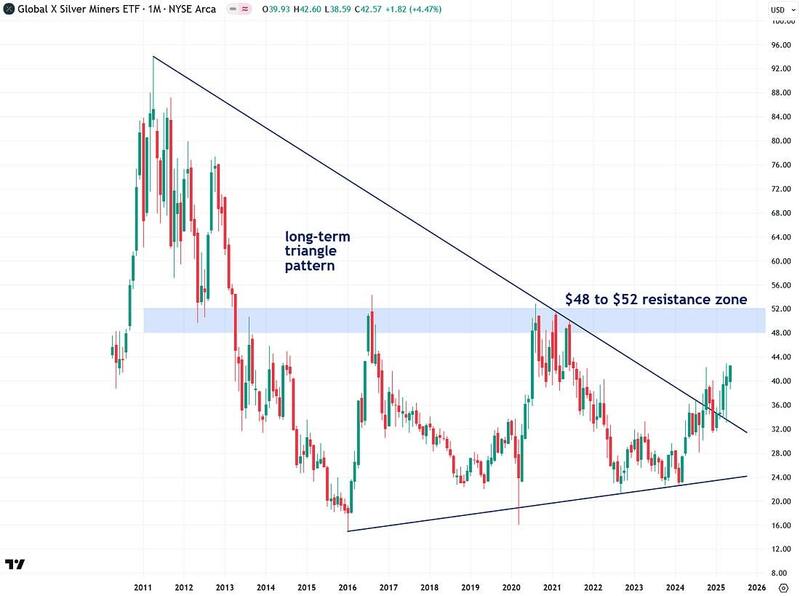
Silver mining stocks, as measured by the Global X Silver Miners ETF (SIL), are also performing well—though they’re slightly lagging behind gold miners. SIL broke out of a long-term triangle pattern a few months ago, which is a bullish development. However, a decisive close above the key $48–$52 resistance zone is still needed to fully confirm that the bull market in silver mining stocks is underway.
In summary, I’m seeing clear signs that precious metals have entered a healthy consolidation phase following a strong rally. This pause is helping them work off their overbought conditions—particularly gold, which is more extended than silver.
That said, I believe there’s still plenty of fuel left in the tank, and this looks more like a breather than a top. Silver, in particular, appears poised to take the spotlight next, and I’m hopeful it does.
For now, I’m closely watching to see which direction gold and silver break from their current consolidation patterns.
If you found this report valuable, click here to subscribe to The Bubble Bubble Report for more content like it.
Jesse Colombo is a financial analyst and investor writing on macro-economics and precious metals markets. Recognized by The Times of London, he has built a reputation for warning about economic bubbles and future financial crises. An advocate for free markets and sound money, Colombo was also named one of LinkedIn’s Top Voices in Economy & Finance. His Substack can be accessed here.