")
(Jesse Colombo, Money Metals News Service) After silver broke through the key technical levels I had been monitoring and writing about on Friday, surging 7% in a single day, I released an in-depth report on the upcoming silver bull market and why it would likely evolve into a silver squeeze.
In this update, I’ll highlight several key factors that everyone should watch to track silver’s progress, confirm the ongoing validity of its breakout, and identify important price targets to keep an eye on.
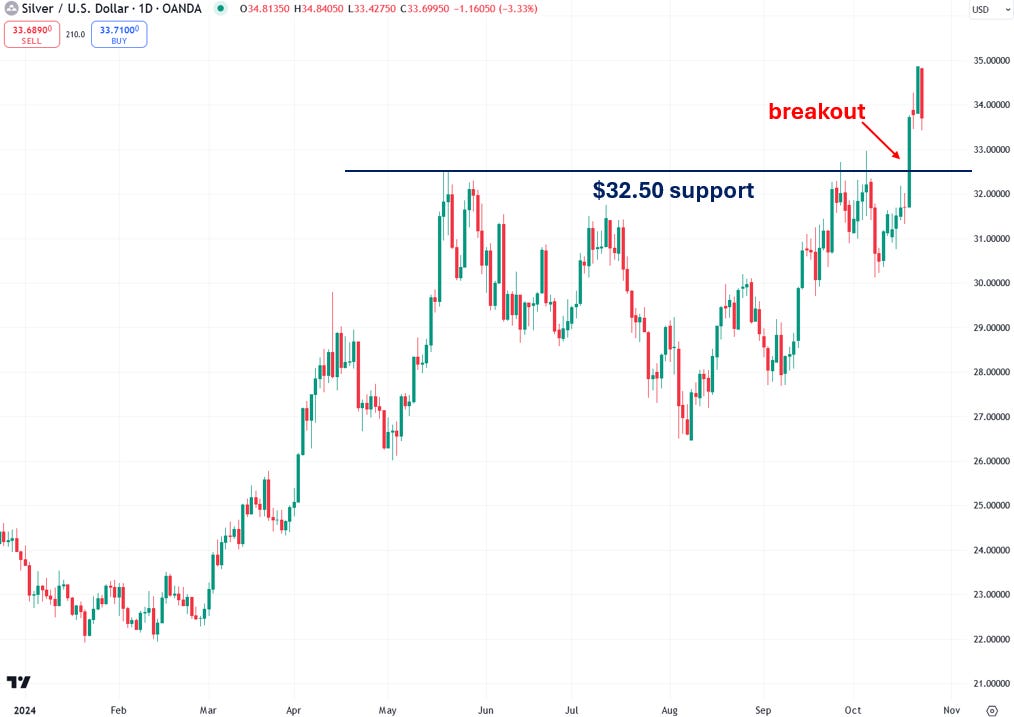
Let’s start with the most rudimentary chart of all: spot silver priced in U.S. dollars.
As you may know, I’ve been emphasizing the importance of the $32.50 level for several months, stating that silver’s bull market would be triggered once it decisively closed above it with strong volume. On Friday, silver knocked it out of the park with a 7% surge on volume that was 50% above the average of the prior week.
Now that silver has broken above that level, it’s in a confirmed uptrend. Today’s 3.33% pullback doesn’t worry me, as silver remains above $32.50, which is now a support or a floor. After such a sharp surge, a pullback is normal and expected. We may see continued bouncing around for a few more days before silver is ready to head even higher.
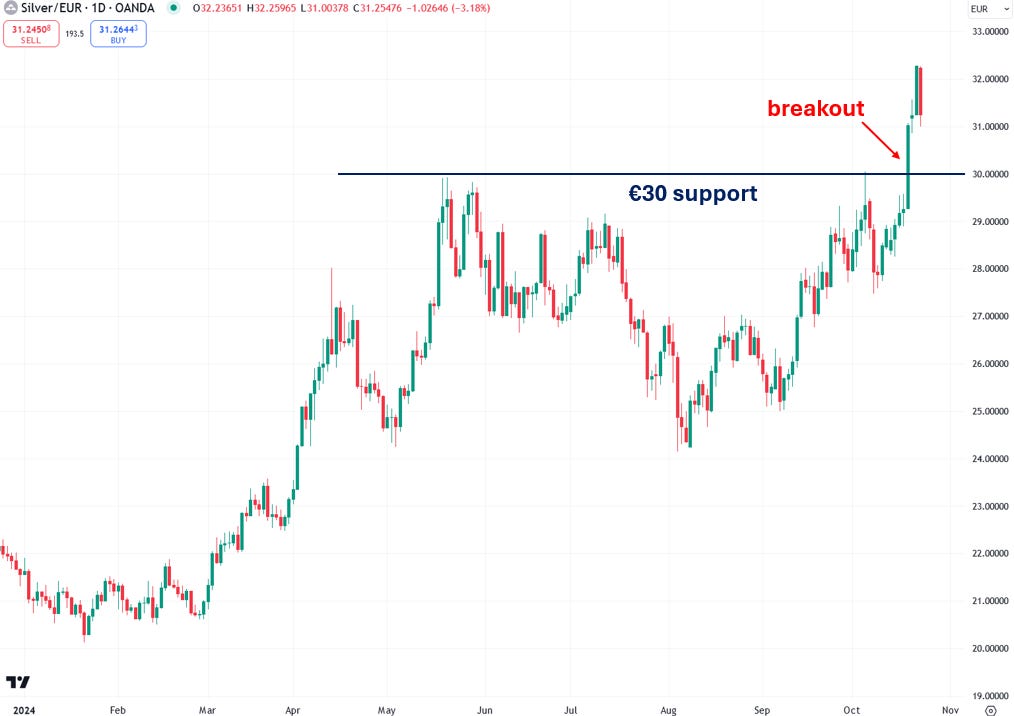
The other key level I’ve been discussing for months is €30 when silver is priced in euros. I closely monitor silver priced in euros because this approach removes the impact of U.S. dollar fluctuations, offering a clearer view of silver’s intrinsic strength or weakness.
Notably, silver priced in euros often respects round numbers like €26, €27, and €28, frequently establishing key support and resistance levels at these points.
On Friday, silver surged above the €30 level with gusto, and that level is now the new floor. As long as silver stays above that level, it can fluctuate all it wants—I won’t be concerned.
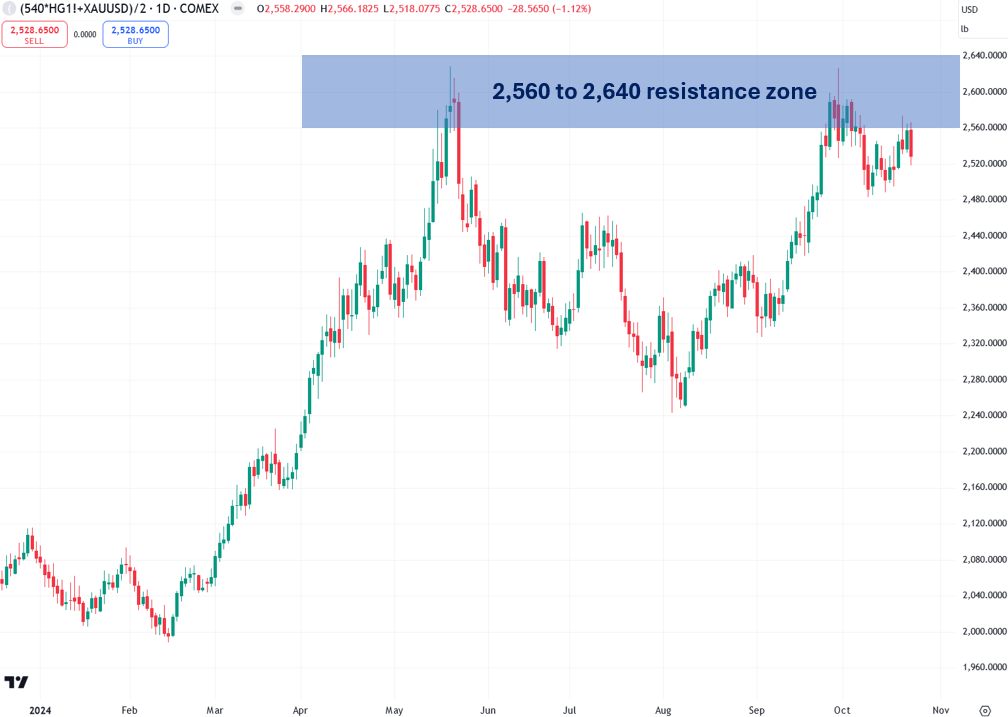
I’ve been discussing my proprietary Synthetic Silver Price Index (SSPI) for some time, which is the average of copper and gold prices. I closely monitor this index due to its strong correlation with silver, making it a valuable tool for confirming silver’s moves, especially breakouts.
I’ve highlighted the index’s key resistance zone between 2,560 and 2,640, noting that a close above this range would help confirm a silver breakout. While this breakout hasn’t happened yet, I believe it’s only a matter of time.
Until the SSPI finally breaks out, however, I see silver’s rally as lacking full staying power. It’s like a car with eight cylinders running on only six—it’s moving but not at its full potential. That partly explains pullback days like today.
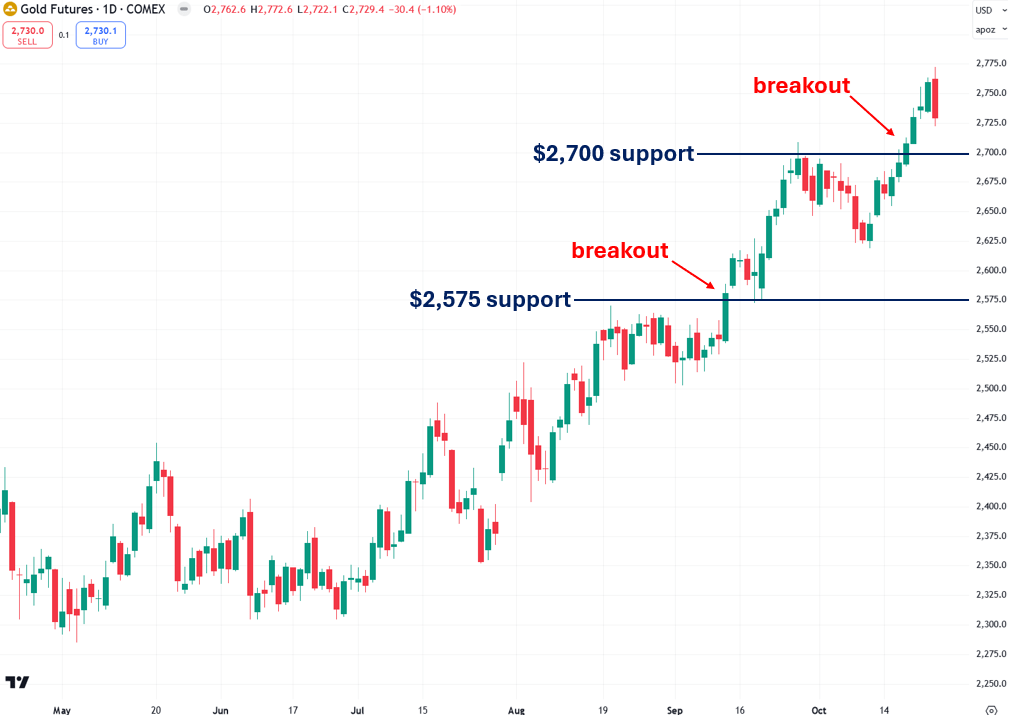
Gold, a major influence on silver prices and a component of the Synthetic Silver Price Index has performed exceptionally well over the past few months, recently breaking above the key $2,700 resistance level (in COMEX gold futures), which now serves as a new support.
Despite yesterday’s 1.1% pullback, gold remains in a confirmed uptrend, which should continue to support silver’s rise. I expect gold to reach $3,000 in the coming months.
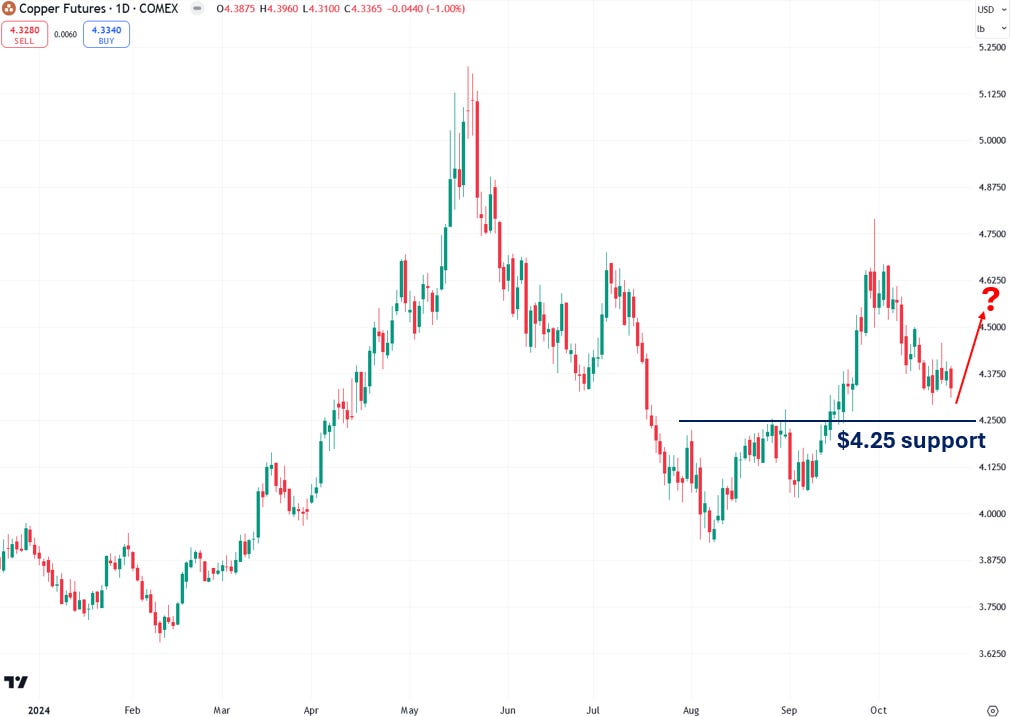
Copper, another key driver of silver prices (learn more), has been sluggish recently, putting pressure on both silver and the Synthetic Silver Price Index.
The good news is that copper is nearing its $4.25 support level and is likely to bounce and rally from there, which should help lift both silver and the SSPI. A rebound in copper is the crucial element needed to spark the SSPI breakout, especially since the other key component, gold, has already been performing strongly.
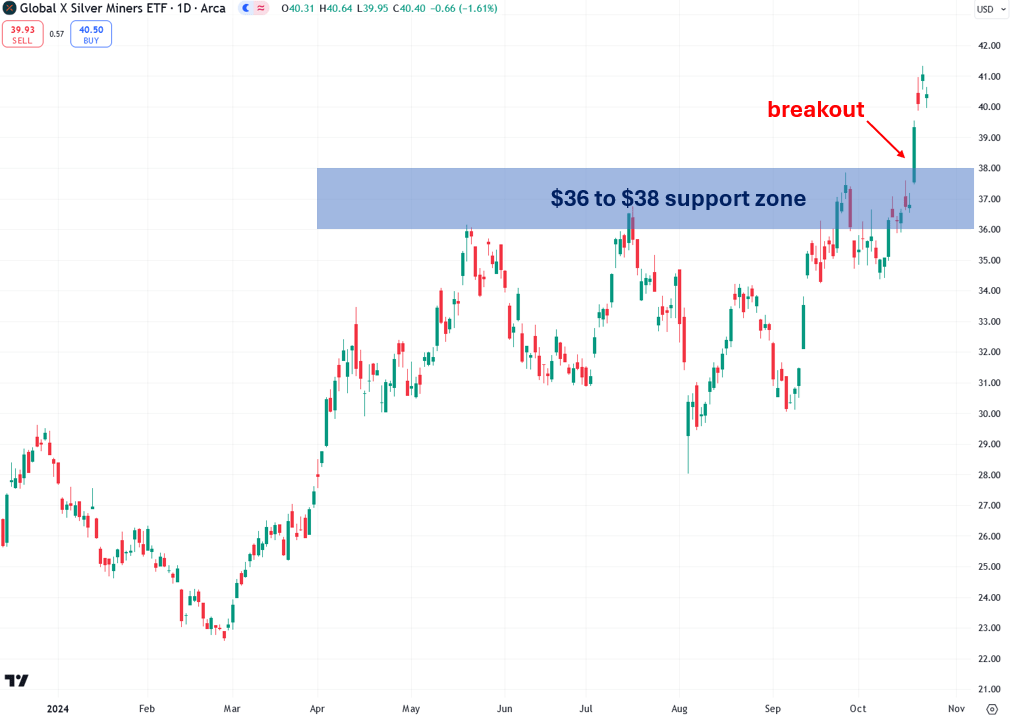
I watch silver mining stocks to confirm moves in the price of silver—particularly the popular Global X Silver Miners ETF (symbol: SIL).
On Friday, SIL closed above the $36 to $38 resistance zone on heavy volume, delivering a strong bullish signal for both silver mining stocks and silver itself. As long as SIL stays above the $36 to $38 zone, it remains in a confirmed uptrend.
While silver pulled back 3.33% today, SIL only dipped 1.61%, indicating high relative strength. Overall, this chart looks excellent to me.
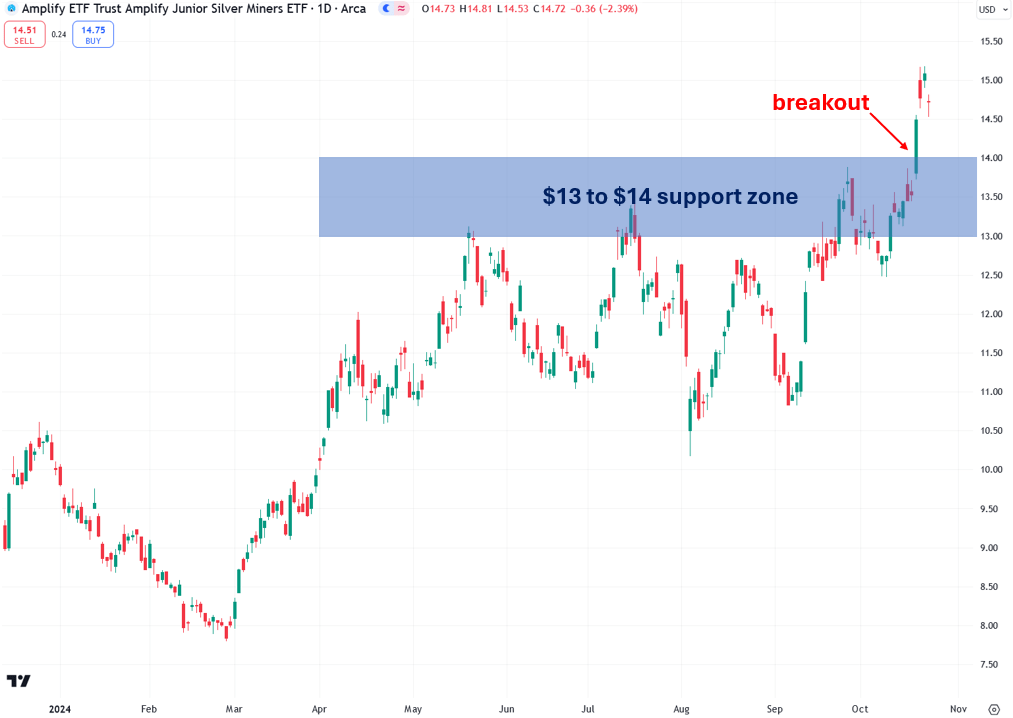
In addition to SIL, I monitor the Amplify Junior Silver Miners ETF (symbol: SILJ), which is the main proxy for junior silver mining shares.
On Friday, SILJ closed above its $13 to $14 resistance zone on heavy volume, issuing a significant bullish signal. As long as SILJ holds above this zone, it remains in a confirmed uptrend.
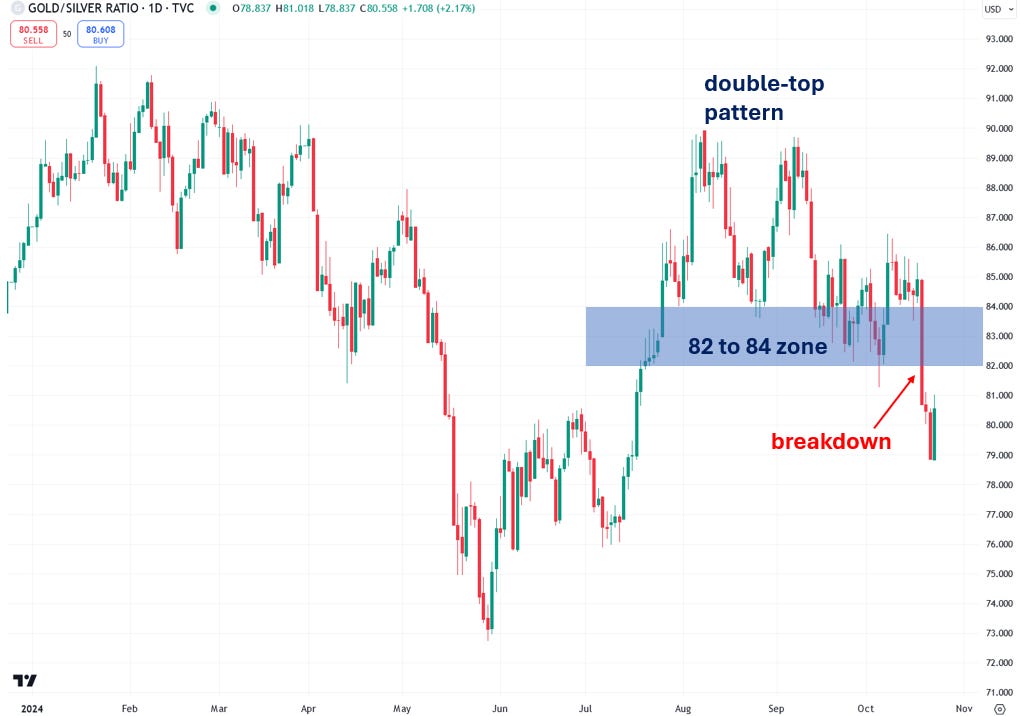
I pay close attention to the gold-to-silver ratio, as it reveals whether silver is outperforming gold or vice versa. A falling ratio indicates that silver is outperforming gold, which is exactly what you want to see to confirm a silver bull run.
On Friday, the ratio closed below the 82 to 84 support zone, which gives further credence to silver’s breakout. Though the index rebounded slightly today, it’s still in a downtrend as long as it remains below the 82 to 84 support zone.
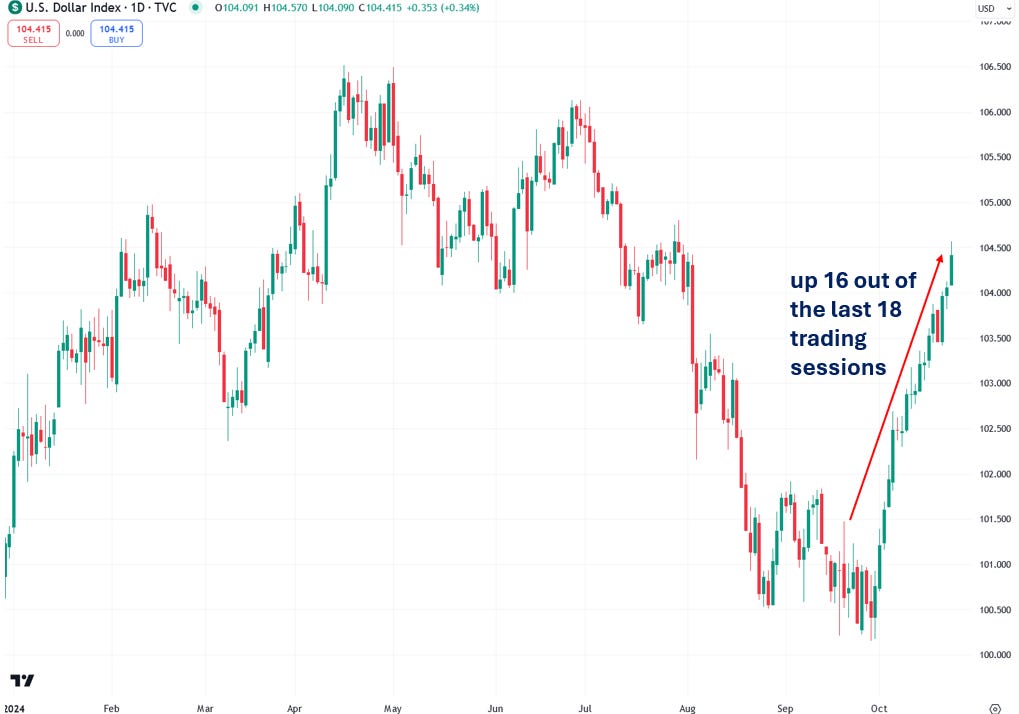
Since the beginning of October, the U.S. Dollar Index has experienced one of its sharpest rallies in recent memory, rising in 16 of the last 18 trading sessions.
Commodities like gold, silver, and copper generally have an inverse relationship with the dollar, so you’d expect them to drop sharply, given the dollar’s strength. However, the fact that they’ve held steady is a strong indication of their resilience.
There’s a good chance that the dollar’s rebound will run its course soon, which should provide support for commodities—particularly copper, which has been struggling due to the strong dollar.
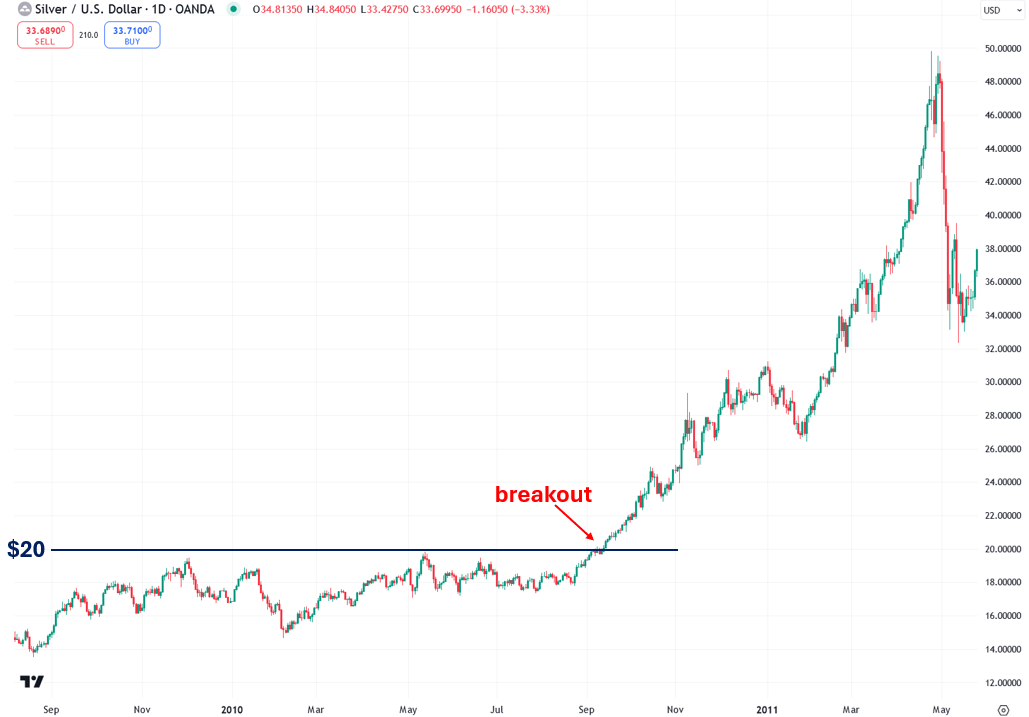
A valuable chart I’d like to highlight is silver’s 2010 chart, just before its explosive breakout, when prices surged from $20 to $50 in just four months.
There are key similarities between silver then and now, including the breakout above $20, which parallels today’s breakout above the $32.50 level. I traded silver during its breakout above $20 back then, and today’s breakout feels similar to that moment.
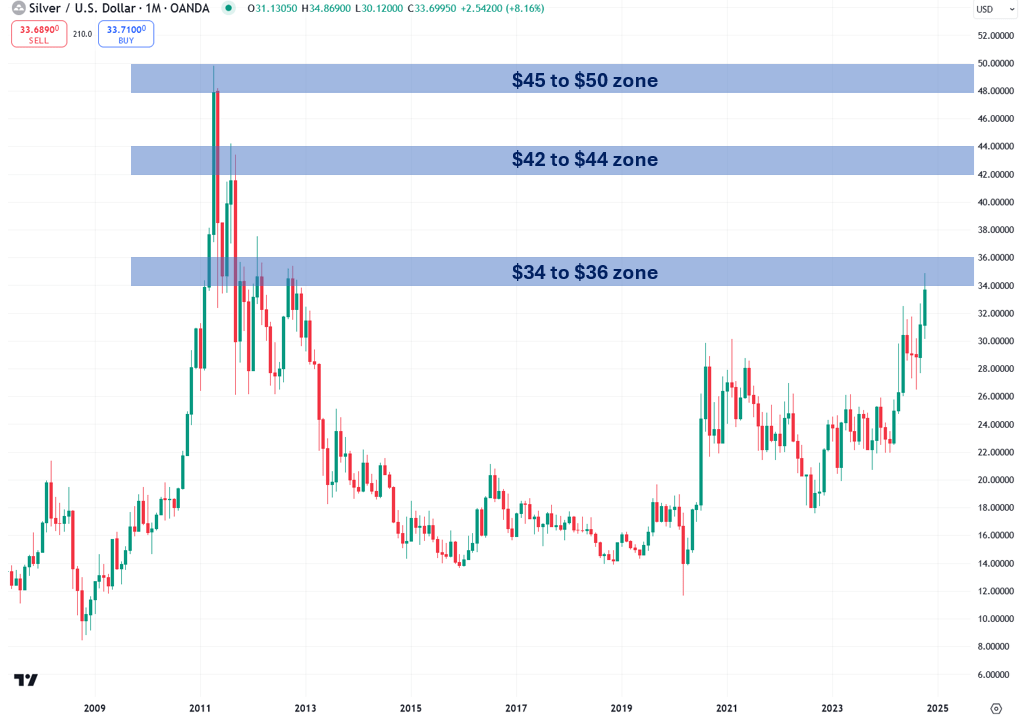
Another valuable chart to consider is silver’s monthly chart, which helps identify potential resistance areas as the bull market unfolds. I analyze previous congestion zones to determine where silver might face temporary challenges.
Each zone acts like a hurdle that silver needs to overcome. Once it does, that level becomes a new floor, and we then focus on the next resistance level, continuing this pattern as the bull market progresses.
Now that silver has broken above the key $32.50 level, the next step is a strong volume close above the $34 to $36 resistance zone, which served as a critical barrier throughout much of 2011.
In conclusion, silver’s recent breakout above $32.50 appears to be the beginning of a major bull run, but there are several key factors to watch moving forward. While silver is in a confirmed uptrend, the breakout will gain more strength if copper rebounds and the Synthetic Silver Price Index follows suit. Gold’s strong performance is already providing support, and silver mining stocks like SIL and SILJ are confirming the move with their own bullish signals.
The next critical step is a strong close above the $34 to $36 resistance zone, which will open the door for much higher prices, paralleling silver’s 2010 breakout. All eyes should remain on these key levels and indicators as the market progresses.
Jesse Colombo is a financial analyst and investor writing on macro-economics and precious metals markets. Recognized by The Times of London, he has built a reputation for warning about economic bubbles and future financial crises. An advocate for free markets and sound money, Colombo was also named one of LinkedIn’s Top Voices in Economy & Finance. His Substack can be accessed here.