")
(Jesse Colombo, Money Metals News Service) Though silver has been quiet lately, it’s important to be aware of the many bullish factors that are setting the stage for a strong move higher.
As an analyst and investor who strongly believes in silver’s long-term potential, I often revisit and share key charts to stay grounded in the bullish thesis—and to help others do the same.
In periods of frustrating stagnation like we’ve seen recently, it’s easy to lose sight of silver’s powerful setup. But these doldrums won’t last forever, and it’s important to keep our eyes on the bigger picture.
In this piece, I’ll walk you through the bullish case for silver, using the latest charts and data to reinforce why this thesis remains as compelling as ever.
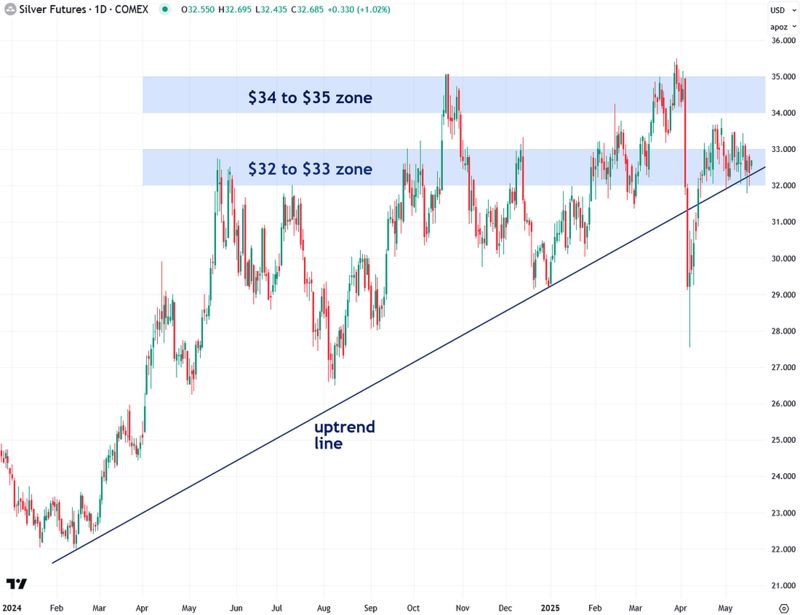
To begin, let’s examine the chart of COMEX silver futures and highlight the key technical levels currently in play.
First, take note of the $32 to $33 resistance zone, which has acted as a stubborn ceiling for much of the past year. A decisive breakout above that zone would issue an important bullish signal.
The next major hurdle is the $34 to $35 zone, which notably capped silver’s rally in late October. A decisive, high-volume close above that level would serve as strong confirmation that a major breakout is underway. Once silver clears both barriers, the path should be wide open for a powerful bull market.
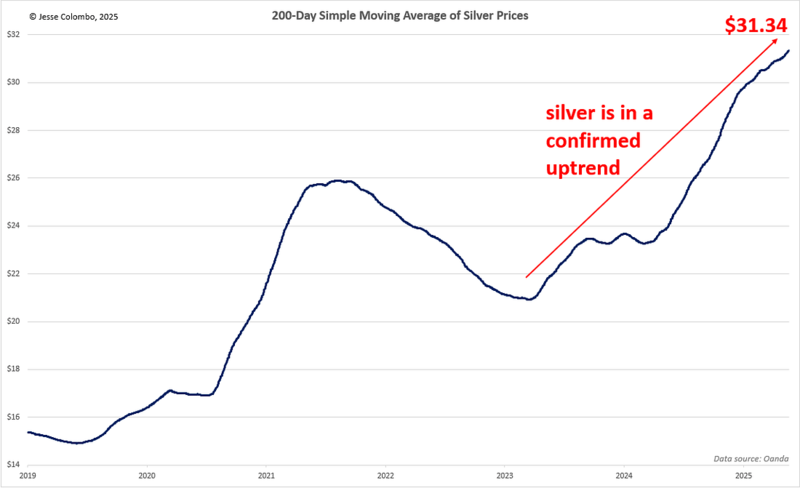
Although silver has traded in a choppy, erratic manner for much of the past year, it is in a confirmed uptrend, despite grinding higher in a frustrating “two steps forward, one step back” manner.
This is evident in the 200-day simple moving average, a helpful tool for identifying an asset’s primary trend by filtering out short-term price fluctuations.
More importantly, the 200-day moving average suggests that the odds favor further gains, as a trend in motion tends to stay in motion—much like Newton’s first law of motion, also known as the law of inertia.
The even better news is that once silver fully breaks out, as discussed earlier, I expect it to rise in a much more orderly fashion rather than continuing its erratic price swings.
One of the key reasons I believe silver is on the verge of a powerful new phase in its bull market is gold’s impressive rally over the past year.
Historically, gold is a major driver of silver’s price, though silver often lags before catching up. With economic uncertainty rising and the risk of a recession increasing, I believe gold still has plenty of upside potential.
As I’ll explain shortly, the higher gold climbs, the more undervalued silver will become relative to gold, making it increasingly difficult for silver to remain at these relatively low levels while gold continues to soar.
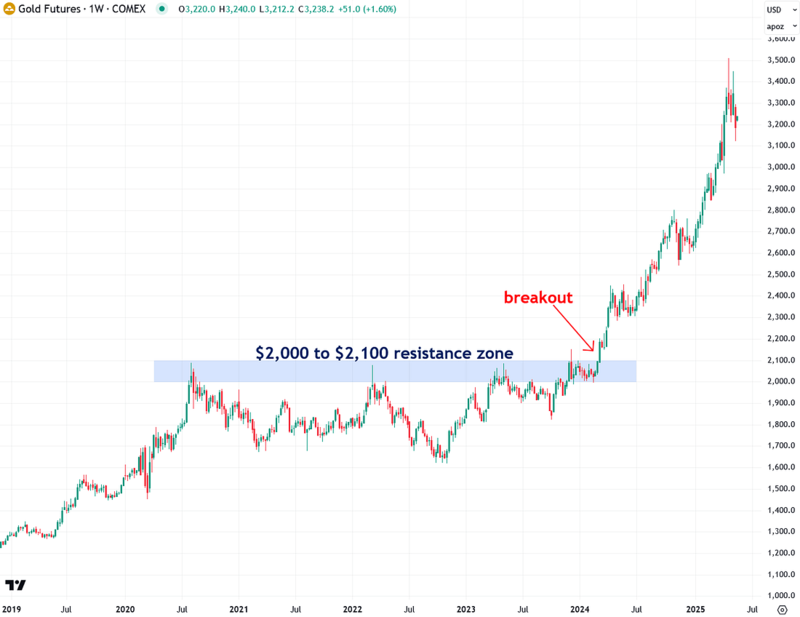
Also, take a look at the chart below and notice how gold struggled from 2020 to early 2024 to break above the $2,000–$2,100 resistance zone, which acted as a price ceiling for much of that period. Despite multiple attempts, gold was repeatedly pushed back down.
However, in March 2024, it finally broke out, igniting the powerful bull market we see today. I see striking parallels with silver’s $32–$33 resistance zone over the past year and believe that once silver manages to truly clear this level, it will soar just as gold did.
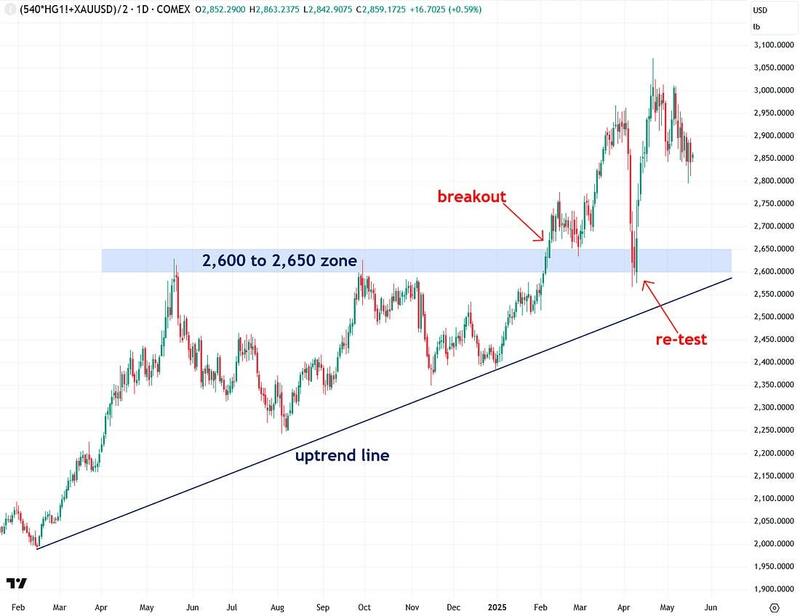
In addition to gold, copper is another key metal that strongly influences silver’s price, as I explained here. This understanding led me to develop the Synthetic Silver Price Index (SSPI)—an indicator designed to validate silver’s price movements and filter out potential fakeouts.
The SSPI is calculated as the average price of gold and copper, with copper adjusted by a factor of 540 to ensure gold doesn’t disproportionately impact the index. Remarkably, despite silver not being an input, the SSPI closely mirrors silver’s price movements.
For much of the past year, I’ve been closely monitoring the SSPI as it repeatedly struggled to break above the critical 2,600 to 2,640 resistance zone. I’ve consistently emphasized that a breakout above this level would serve as a major bullish confirmation for silver.
That long-awaited breakout finally occurred in February—driven in part by strong rallies in both copper and gold—signaling a notable tailwind for silver. As long as the SSPI holds above this zone and continues to climb, the odds of a silver rally grow increasingly likely.
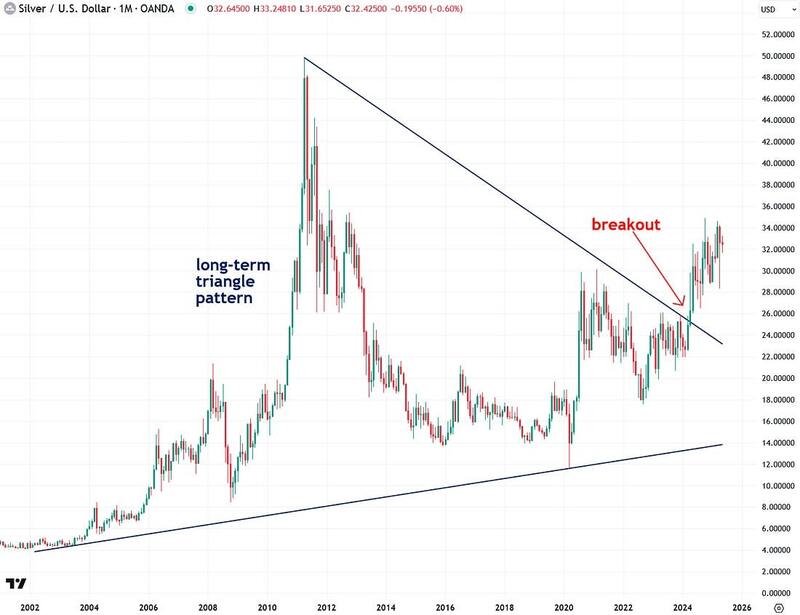
Another strong indication that silver is on the verge of a powerful bull market is its breakout in April 2024 from a two-decade-long triangle pattern:
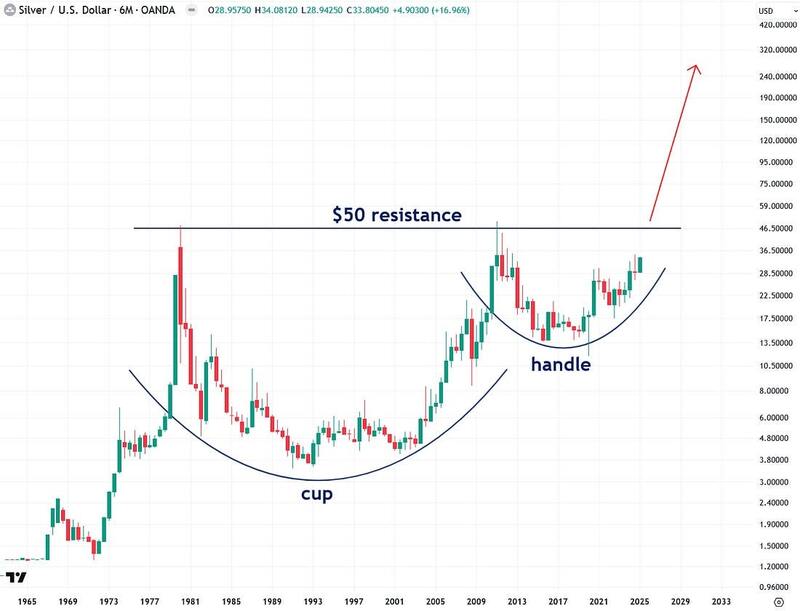
Even more exciting is the fact that silver’s logarithmic chart, dating back to the 1960s, reveals a cup-and-handle pattern, indicating the potential for silver to reach several hundred dollars per ounce during this bull market.
In order to confirm this particular scenario, silver needs to close decisively above the $50 resistance level.
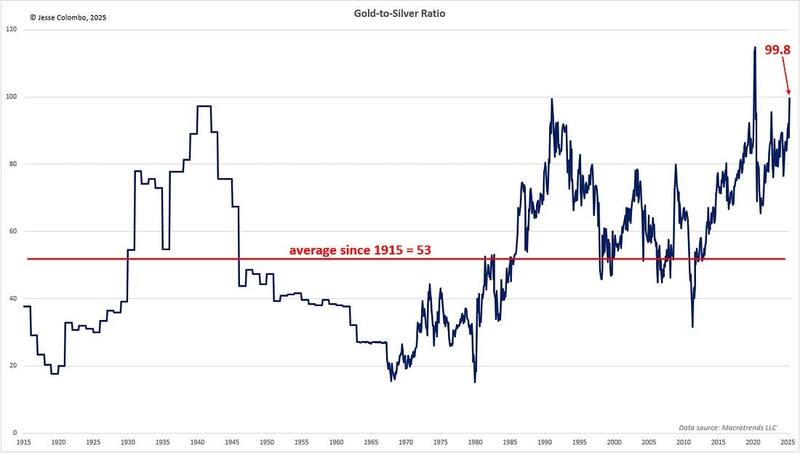
The long-term gold-to-silver ratio chart clearly shows that silver is significantly undervalued relative to gold, indicating that silver has substantial upside potential. As silver rises to close this gap, the ratio would decline.
The current gold-to-silver ratio stands at 99.8, but if it were to revert to its historical average of 53 since 1915—without any increase in gold’s price—silver would be valued at a solid $61.2 per ounce (which is nearly double the current price of $32.50).
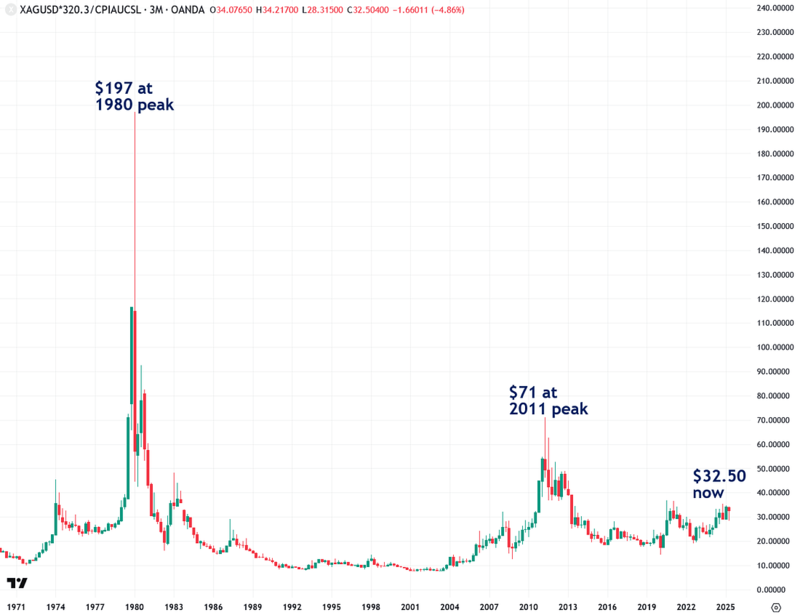
Adjusting silver’s price for inflation further highlights how undervalued it is by historical standards. During the Hunt brothers-induced spike in 1980, silver reached an inflation-adjusted price of $197. In the 2011 bull market, driven by quantitative easing, it hit $71.
Currently trading at just $32.50, silver has significant room to rise if it’s to catch up with these previous inflation-adjusted peaks.
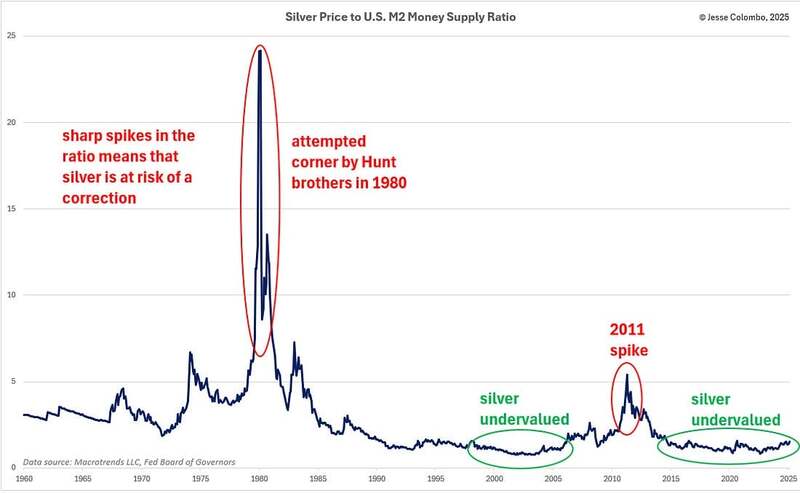
Another way to assess whether silver is undervalued or overvalued is by comparing it to various money supply measures. The chart below shows the ratio of silver’s price to the U.S. M2 money supply, providing insight into whether silver is keeping pace with, outpacing, or lagging behind money supply growth.
If silver’s price significantly outpaces money supply growth, the likelihood of a strong correction increases. Conversely, if silver lags behind money supply growth, it suggests a potential period of strength ahead.
Since the mid-2010s, silver has slightly lagged behind M2 growth, which, combined with other factors discussed in this piece, positions it for a strong rally.
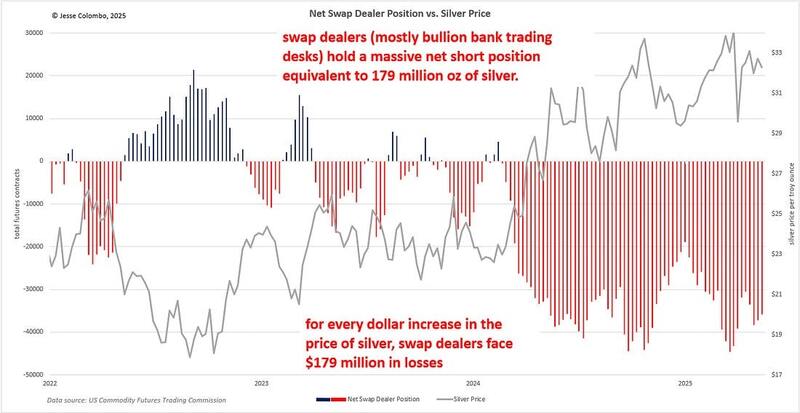
One of the key factors keeping silver’s price suppressed over the past year, even as gold surged, has been the heavy short-selling of COMEX silver futures by swap dealers—primarily the trading desks of bullion banks such as JPMorgan and UBS.
In the process, they amassed a massive net short position of 35,733 futures contracts, equivalent to 179 million ounces of silver—over one-fifth of the annual global silver production. This staggering figure highlights the immense downward pressure exerted on the silver market.
What’s even more astonishing is how much of this short position in silver futures is naked, meaning it isn’t backed by physical silver. It’s merely “paper” silver being dumped onto the market to suppress prices.
However, once silver finally breaks out, it could trigger a wave of short-covering—when traders who bet against an asset through short-selling are forced to buy it back as prices rise to limit their losses. As the price climbs, these traders become increasingly desperate to close their positions, further fueling the rally.
If the buying pressure is intense enough, it could even lead to a short squeeze, dramatically amplifying silver’s upward momentum. Given the size of their short position, bullion banks stand to lose approximately $179 million for every $1 increase in the price of silver—a setup for a major price surge. Now, just imagine what will happen as silver climbs by $5, $10, $20, and beyond from this point.
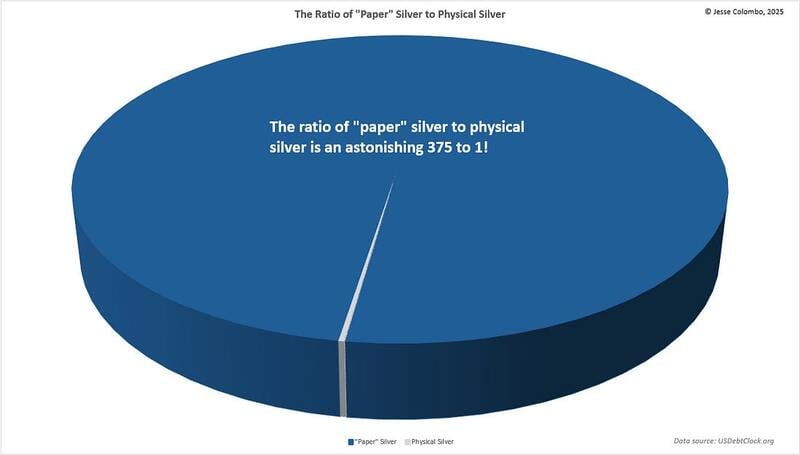
The risk of an explosive silver short squeeze is further amplified by the astonishing ratio of 375 ounces of “paper” silver—ETFs, futures, and other derivatives—for every single ounce of physical silver.
In a violent short squeeze, holders of “paper” silver could be forced to scramble for the extremely scarce physical silver to fulfill their contractual obligations.
This would cause the price of “paper” silver products to collapse, while physical silver prices would skyrocket to jaw-dropping levels, potentially reaching several hundred dollars per ounce (this event is what may fulfill the price target implied by the cup and handle pattern I showed earlier).
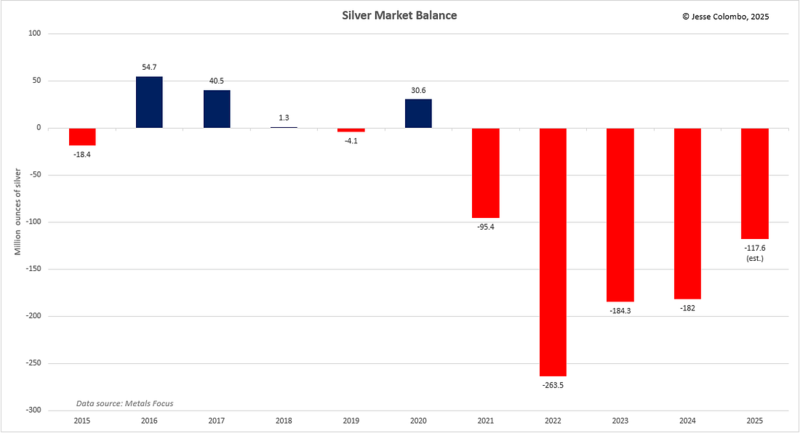
One key reason I believe silver will soon break free comes down to basic Economics 101: supply and demand. Over the past five years, silver demand has consistently exceeded supply, resulting in a persistent deficit.
In 2024 alone, the shortfall reached 182 million ounces, with an estimated additional 117.6 million ounces this year—and deficits are expected to continue for the foreseeable future.
As a result, above-ground silver stocks are dwindling rapidly. While bullion banks can create unlimited amounts of paper silver to suppress prices, they can’t manufacture the real physical silver that is crucial for a wide range of industries, alongside growing investment demand.
The persistent silver deficit stems from both dwindling supply and surging demand—a combination that, in an unmanipulated market, would naturally drive prices higher. That’s why I see silver as a beach ball being held underwater—pressure is building, and it won’t stay suppressed for much longer.
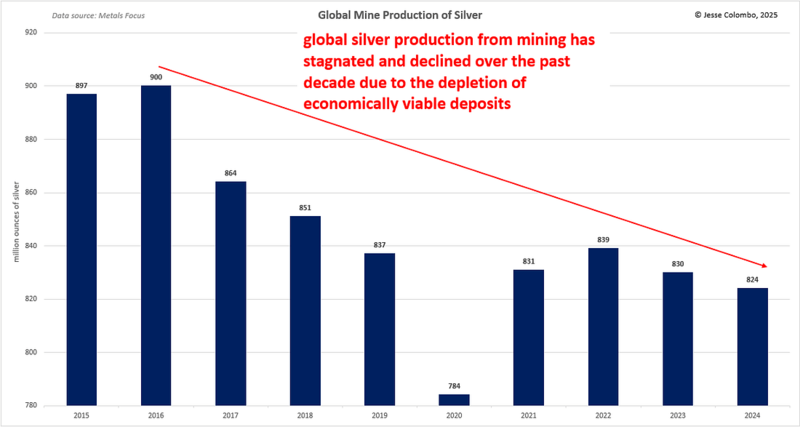
On the supply side, global silver mine production has peaked and declined over the past decade as economically viable deposits become depleted—something the bullion banks have absolutely no control over. And as time goes on, this supply crunch is only likely to worsen.
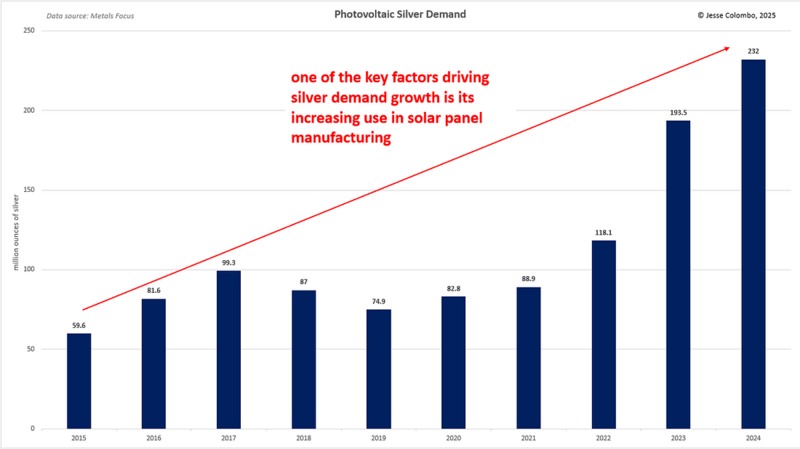
At the same time, demand for physical silver has skyrocketed across multiple sectors, with the biggest driver being the surge in solar panel manufacturing. As the world shifts away from fossil fuels toward renewable energy, this trend is only in its early stages.
Silver demand for photovoltaic (solar panel) applications alone has nearly tripled over the past four years, increasing by an astonishing 143.1 million ounces. With global efforts to expand clean energy accelerating, this demand is set to grow even further.
It’s important for silver investors to understand just how much industrial demand influences the price of the metal—unlike gold, which is considered a “pure” precious metal with relatively limited industrial use. Silver is a hybrid metal, serving both industrial and monetary roles, but its industrial demand far exceeds its investment demand.
This dual nature makes silver uniquely sensitive to both economic trends and investor sentiment. That said, I expect physical silver investment demand to ultimately surge as the precious metals bull market advances and a major financial reset unfolds.
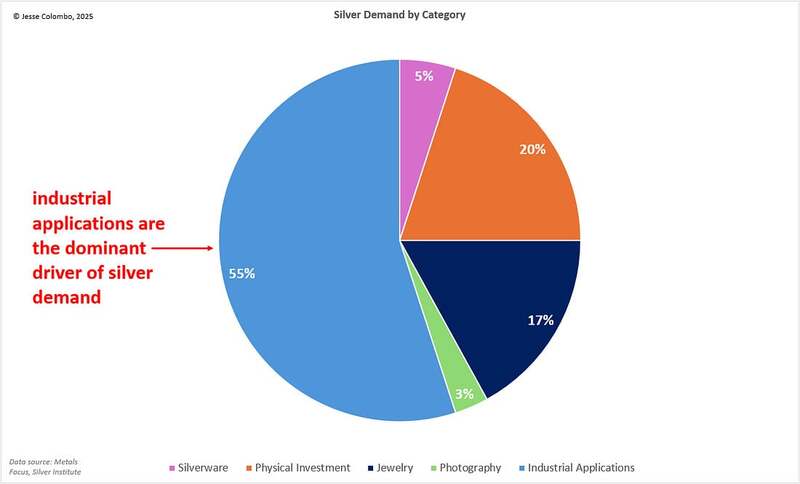
As the pie chart below shows, the majority of silver demand—about 55%—comes from industrial use, while only around 20% comes from investment. In contrast, gold demand is driven largely by investment (44.57%) and jewelry (48.74%), with much of that jewelry serving as a form of investment as well, particularly in developing countries like India and China.
As we begin to wrap up, I’d like to touch on some key ways to position for the coming silver bull market. First and foremost, I’m a big fan of “stacking” or dollar-cost averaging physical silver bullion—an approach that’s well-suited for most investors.
However, as someone with a higher-than-average risk tolerance, I also look to silver mining stocks for their amplified upside potential. These stocks are leveraged to the price of silver and tend to move more dramatically—both up and down—so they’re not for the faint of heart. While riskier than holding bullion, they can offer explosive returns when silver truly takes off.
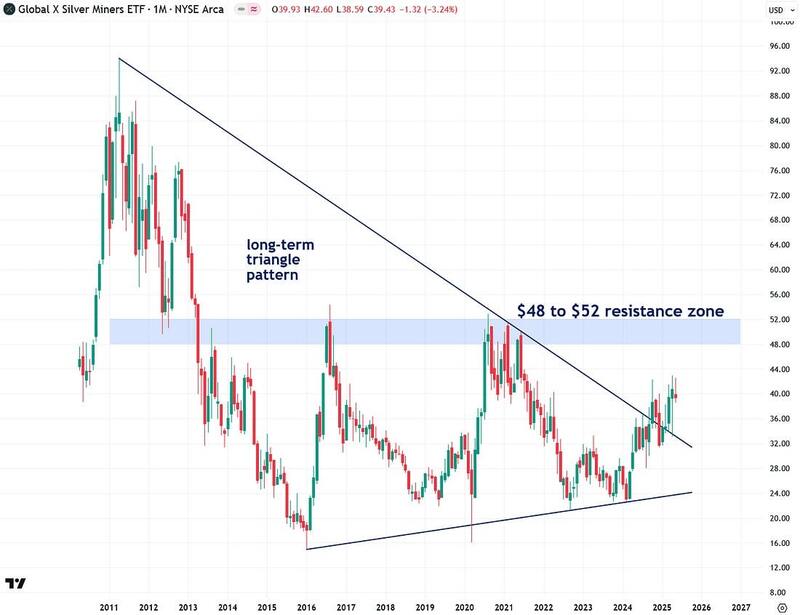
I use the Global X Silver Miners ETF (SIL) as a useful proxy to track the performance of silver mining stocks. SIL broke out of a long-term triangle pattern a few months ago, which is a bullish development.
However, a decisive close above the key $48–$52 resistance zone is still needed to fully confirm that the bull market in silver mining stocks is underway.
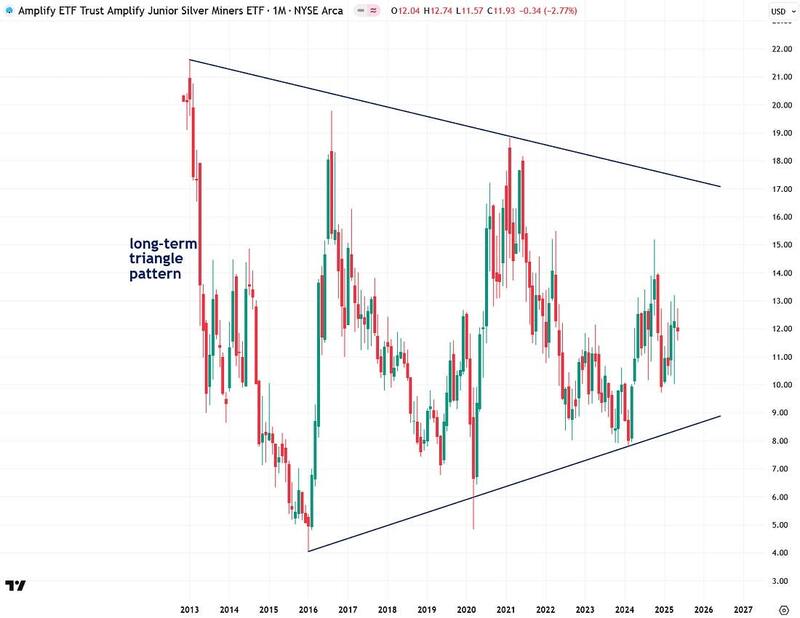
Junior silver mining stocks, as measured by the SILJ ETF, are beginning to show signs of life but remain confined within a long-term triangle pattern that dates back to 2013.
Once this pattern decisively breaks to the upside, I believe silver mining stocks—especially the juniors—are poised to surge in a truly spectacular fashion.
To summarize, while many investors continue to overlook silver due to its recent subdued performance, they’re missing the many positive factors quietly building behind the scenes.
From its historically low valuation across multiple metrics to the persistent supply-demand imbalance that’s rapidly depleting global inventories, silver is setting the stage for a major bull market.
I believe the years ahead will be highly rewarding for silver investors—but only for those with the faith and tenacity to stay the course. That’s exactly why I produce these reports: to remind both myself and my subscribers of the once-in-a-lifetime opportunity silver represents right now.
If you found this report valuable, click here to subscribe to The Bubble Bubble Report for more content like it.
Jesse Colombo is a financial analyst and investor writing on macro-economics and precious metals markets. Recognized by The Times of London, he has built a reputation for warning about economic bubbles and future financial crises. An advocate for free markets and sound money, Colombo was also named one of LinkedIn’s Top Voices in Economy & Finance. His Substack can be accessed here.