
(Money Metals News Service) The U.S. dollar has been breaking down as capital continues to flow out of America, creating a strong tailwind for gold.
Meanwhile, the yellow metal rallied to $3,500 in last night’s overnight session but has since pulled back to trade near yesterday’s close of $3,437.
Frenetic Chinese buying is a major driver fueling this month’s gold rally, but so is the rotation of capital out of stocks and bonds into the best-performing asset class of the year, by far.
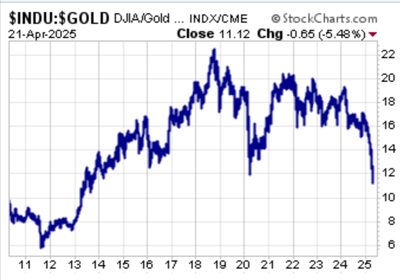
The Dow:Gold ratio is breaking down badly – i.e., stocks are doing even worse in terms of gold.
If this key ratio returns to its 2011 low, that points to a 50% further decline in stocks as compared to gold bullion.
Meanwhile, silver is trading sideways around $32.90 this morning. The “poor man’s gold” continues its underperformance to gold but has nevertheless been handily beating general U.S. stock indices.
Both buying and selling of gold coins, bars, and rounds have increased in recent days.
Premiums at Money Metals remain at multi-year lows – meaning that purchasers are able to acquire gold ounces at just a smidgeon over the global spot price.