")
(Jesse Colombo, Money Metals News Service) For the past several weeks, I’ve been writing about an imminent silver breakout that could quickly push prices to $50. During this time, I’ve observed significant investor cynicism, as many grew frustrated with silver’s sideways movement over the last five months.
I encouraged investors to remain confident, as I believed silver was on the brink of a historic bull market. Sure enough, on Friday, what began as a typical day saw silver surge nearly 7%, meeting the criteria I had outlined to confirm the next phase of its bull market.
Here I will break down the details of silver’s Friday breakout and explain why a powerful silver squeeze has now officially begun.
The key criterion I outlined to confirm the next leg of the silver rally was simple yet widely overlooked by investors and surprisingly difficult to achieve: the spot price of silver must decisively close above the $32.50 resistance level, supported by strong trading volume. The $32.50 resistance level was set at the May high, after which silver retreated and stagnated over the summer.
Silver made attempts to break through this level on September 26th and October 4th, but both attempts failed, resulting in further pullbacks. Silver’s impressive $2.02 (6.38%) surge on Friday, accompanied by trading volume more than double the prior week’s average, definitively fulfills that criterion. (A caveat to consider is that if silver closes back below the $32.50 resistance level, it would invalidate Friday’s bullish signal. However, I find that scenario unlikely.)
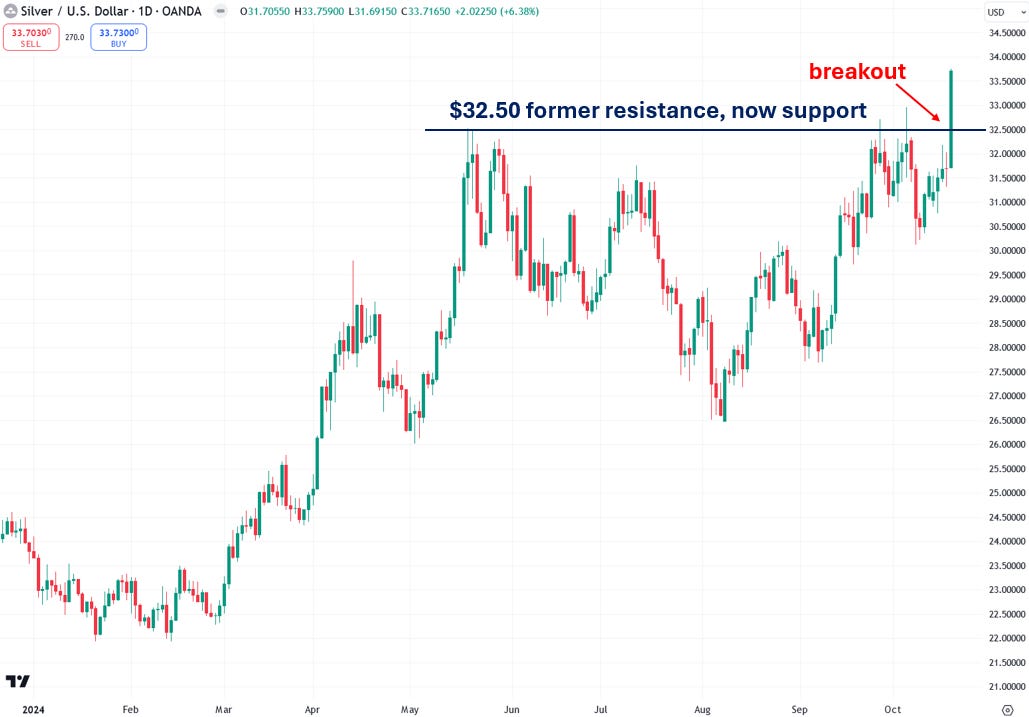
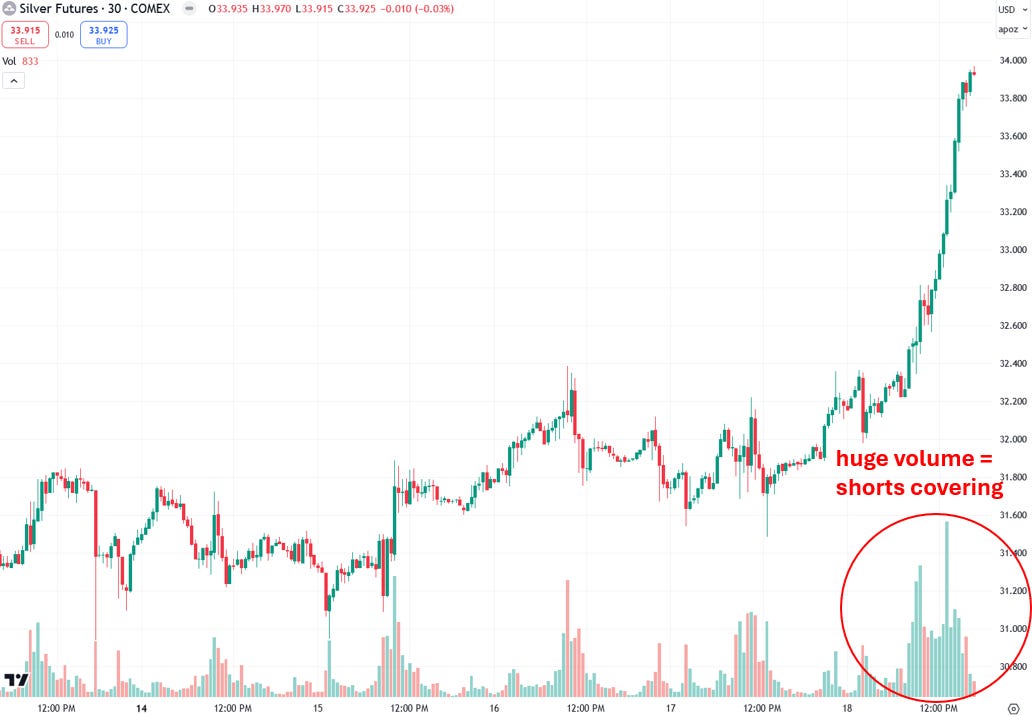
Although Friday’s trading began like any ordinary day, volume surged in the afternoon as it became evident that silver’s breakout above the $32.50 resistance level had staying power.
It’s likely that a good portion of this volume came from traders scrambling to cover their short positions—a topic I’ll explore in greater detail later in this article. The heavy trading volume serves as a crucial confirmation of silver’s breakout, signaling that major institutions or ‘smart money’ are getting on board. This significantly reduces the likelihood that this is a false breakout.
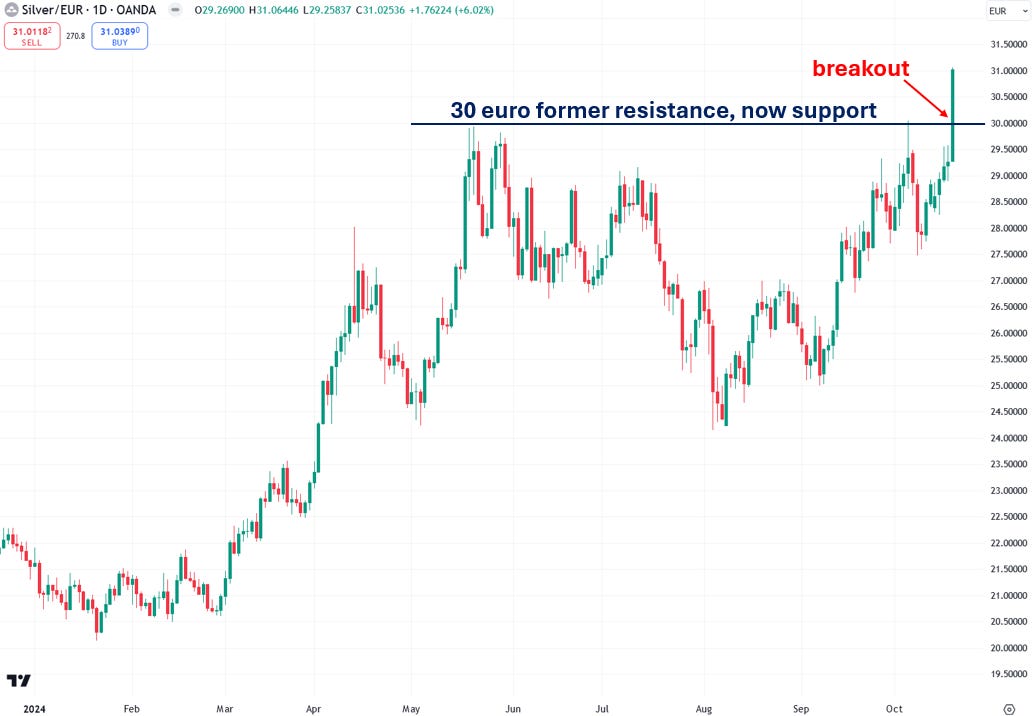
The next condition I outlined was that silver priced in euros must decisively close above the €30 resistance level, which was established at the May peak. I stated that this event would help confirm a close above $32.50, greatly reducing the chances of it being a false breakout.
I find it valuable to analyze silver priced in euros, as this approach removes the impact of U.S. dollar fluctuations, offering a clearer view of silver’s intrinsic strength or weakness. Notably, silver priced in euros often respects round numbers like €26, €27, and €28, frequently establishing key support and resistance levels at these points. On Friday, silver finally broke through the €30 level with such momentum that it even closed above €31, signaling the strong potential for further gains in the coming week.
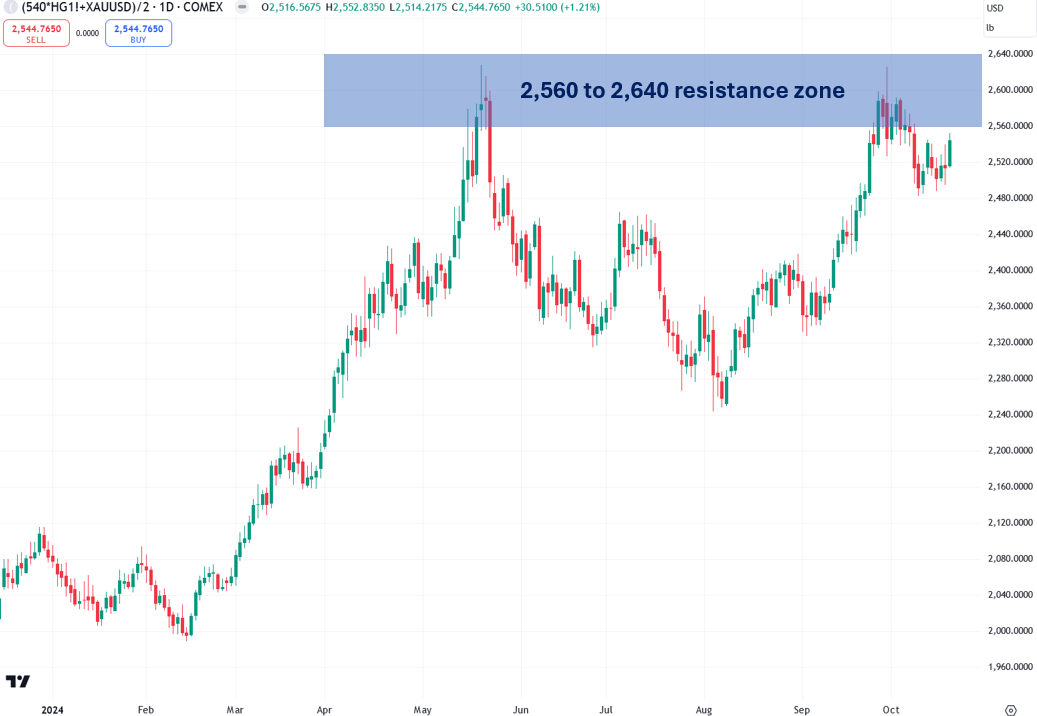
The final condition I listed is more esoteric, but I believe it will significantly reduce the likelihood of a silver breakout being a false one: an index I developed, called the Synthetic Silver Price Index, must close above its key resistance zone between 2,560 and 2,640. This index represents the average of gold and copper prices, with copper’s price adjusted by a factor of 540 to prevent gold’s higher price from disproportionately influencing the index.
The price of copper is an often overlooked factor in silver’s performance and rivals the influence of gold. The index closely mirrors silver’s price movements, yet surprisingly, silver’s price itself isn’t even an input!
Although the Synthetic Silver Price Index didn’t break out on Friday, it still posted a solid 1.21% gain. Given the sheer strength of silver’s breakout, I’m choosing to overlook this criterion for now.
I expect a breakout in the index is still forthcoming, which will further validate silver’s rally and likely provide additional momentum to its current upward trajectory. The index didn’t break out primarily due to copper’s weakness over the past few weeks. However, with a rebound in copper likely soon (as I’ll explain shortly), this should help the index break out in the near future.
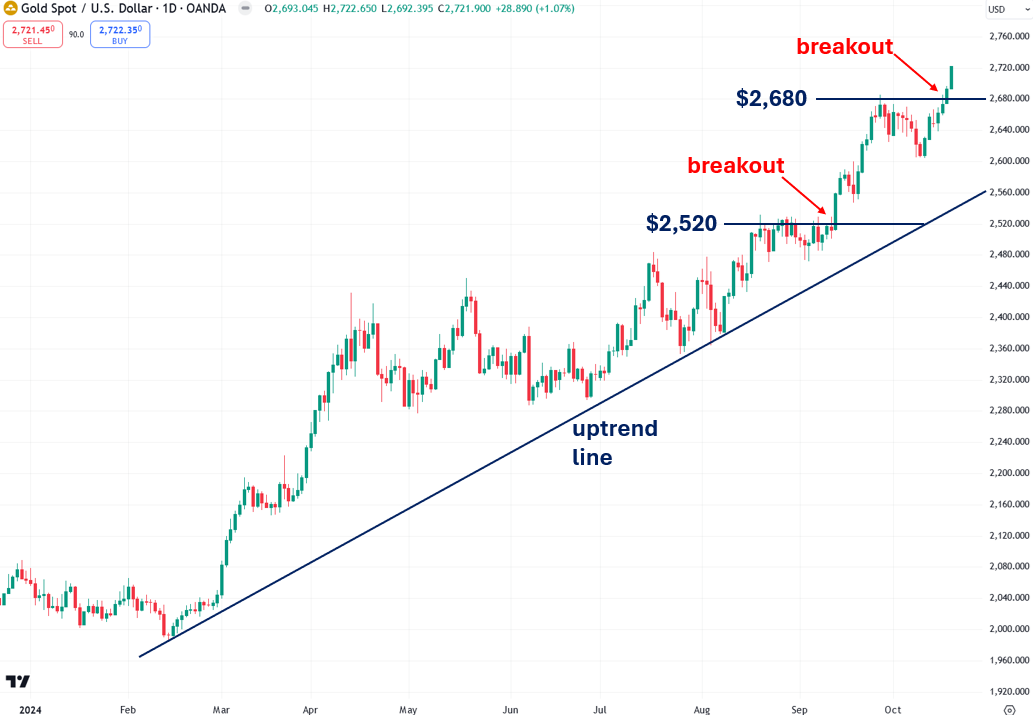
Gold, a major driver of silver prices, is generating a strong tailwind for silver after breaking through two key resistance levels since September. By every measure, gold is in a confirmed uptrend, and I believe it’s on track to reach $3,000 in the near future.
This momentum should continue to bolster silver’s rally. While gold reaching $3,000 might be a bit far-fetched, it’s actually quite realistic, as it’s just over a 10% increase from today’s price.
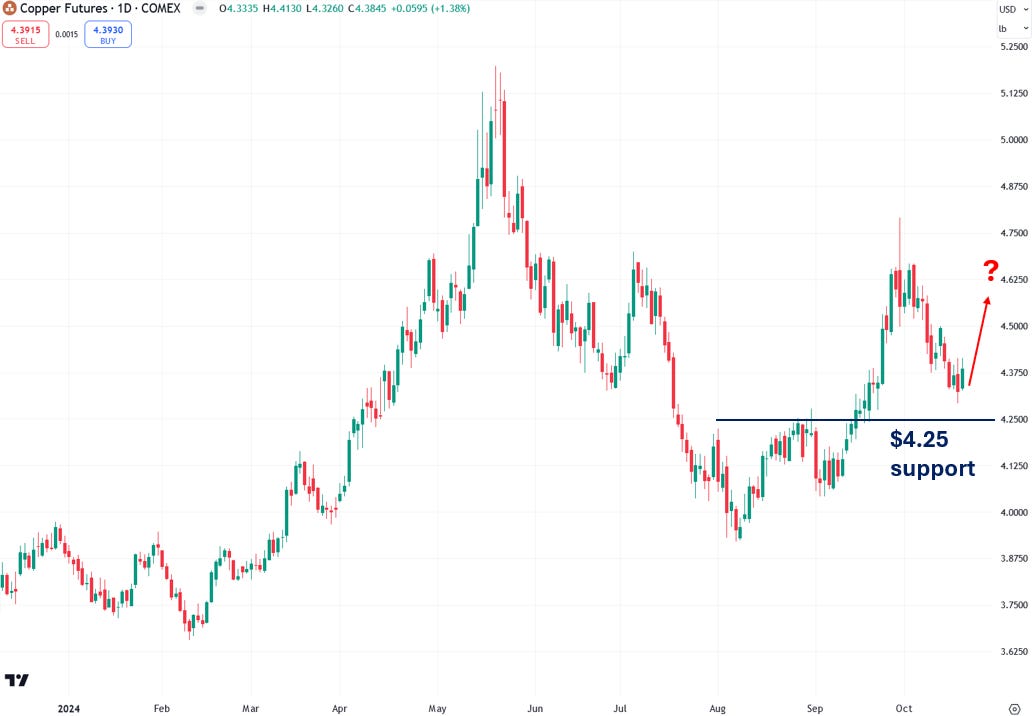
The price of copper is often an underappreciated factor in silver’s performance. Copper’s recent decline has weighed on silver, but there is a strong likelihood that it will find support around the $4.25 level and bounce from there. This rebound should provide an extra boost to silver’s nascent rally.
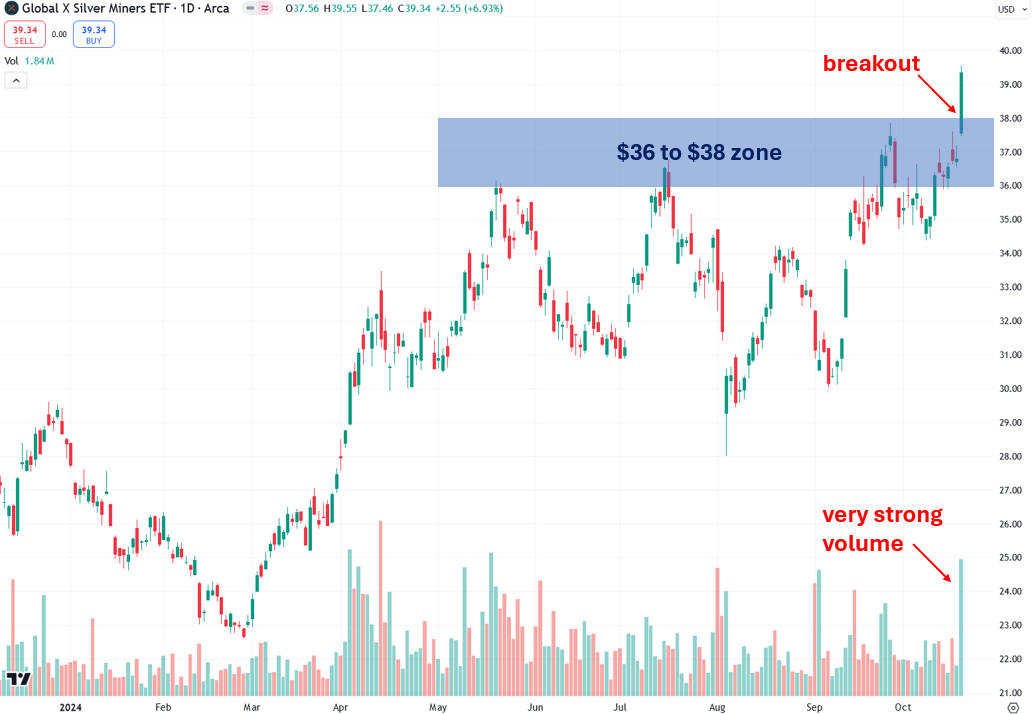
Silver mining stocks are also important to watch for confirming silver’s price movements, as they often mirror investor sentiment toward the metal. The Global X Silver Miners ETF (symbol: SIL), the most heavily traded silver mining stock ETF, had been stuck in a flat range since April.
I’ve been stating that a strong, high-volume close above the $36 to $38 resistance zone would indicate that both silver and silver mining stocks are primed for a major breakout—and that’s exactly what occurred on Friday. I believe that those who were lamenting the poor performance of silver mining stocks will soon be singing a different tune!
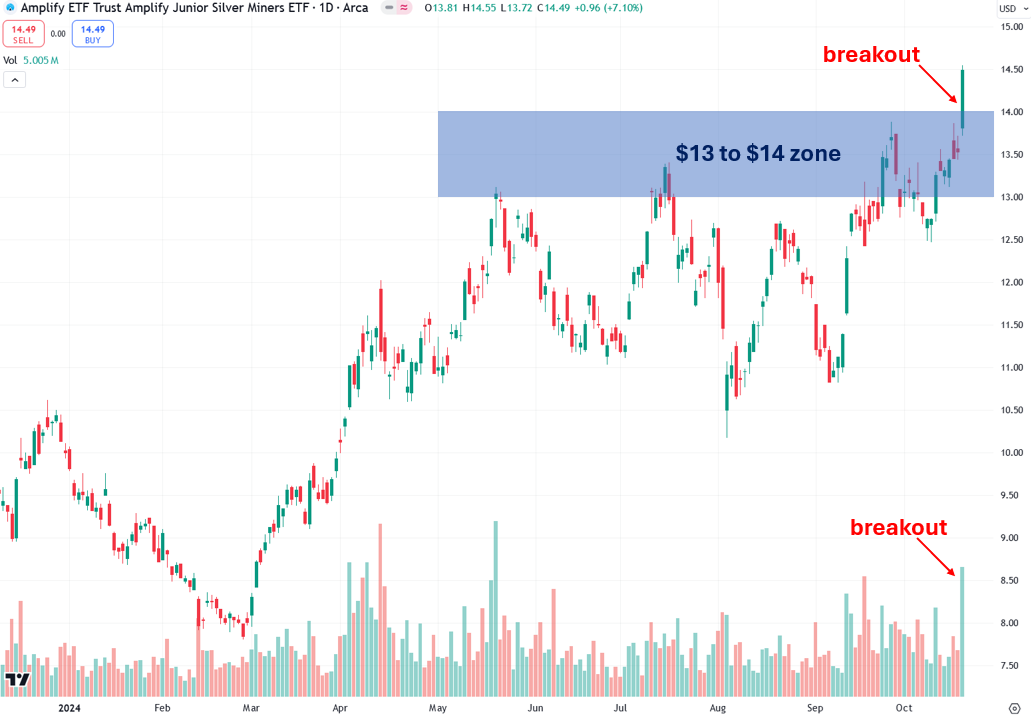
Similarly, the Amplify Junior Silver Miners ETF (symbol: SILJ)—a key proxy for junior silver mining shares—broke above its $13 to $14 resistance zone:
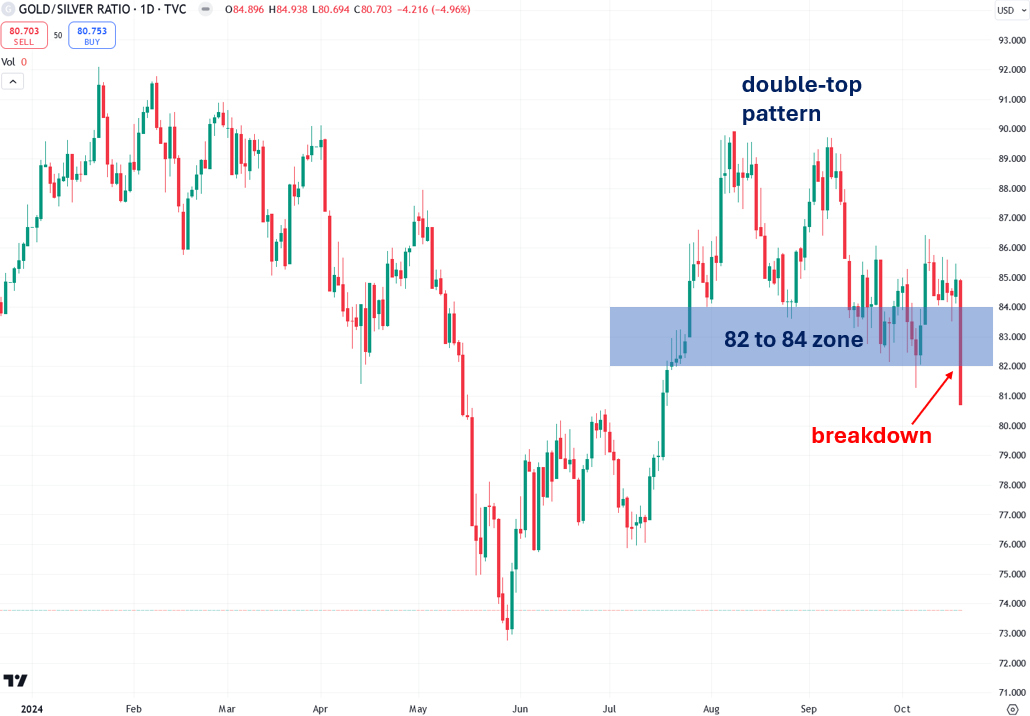
Another key confirmation I’ve been watching for is a breakdown in the gold-to-silver ratio, a useful indicator for assessing silver’s price trajectory.
As I stated, a close below the 83 to 84 support zone is valuable for confirming the start of a silver rally and its outperformance over gold—and that’s exactly what happened on Friday:
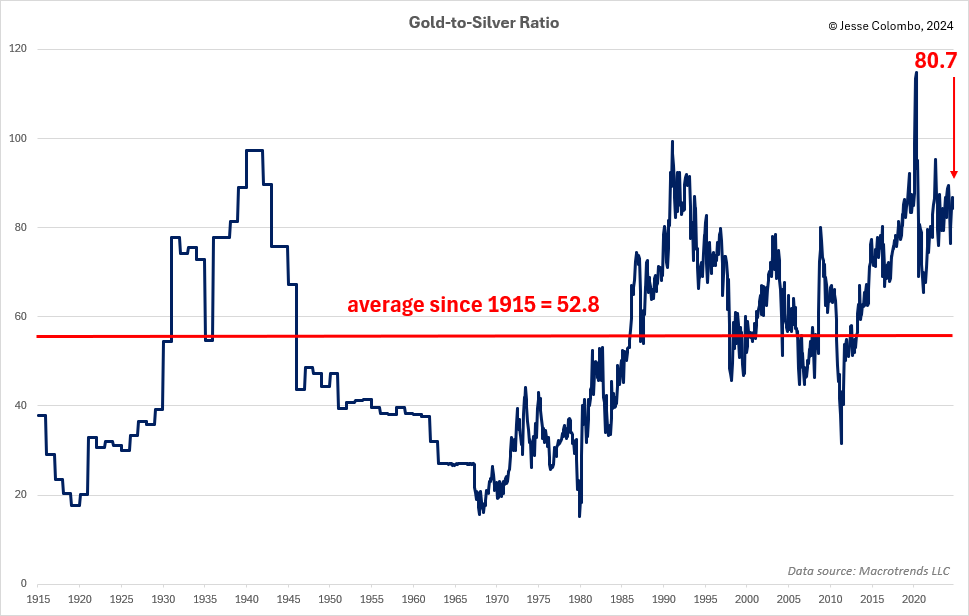
The long-term gold-to-silver ratio chart reveals that silver is currently significantly undervalued compared to gold, indicating that silver has much more room to rise in order to catch up.
If the ratio were to revert to its historical average of 52.8 since 1915, even without any increase in gold’s price, silver would be valued at a respectable $51.55 per ounce.
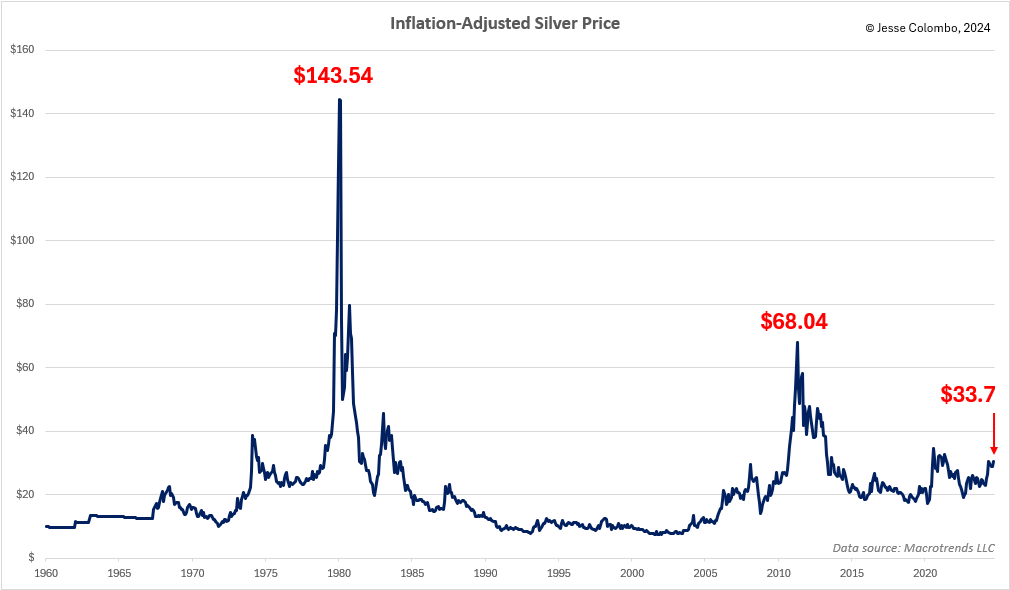
Adjusting silver’s price for inflation further highlights how undervalued it is by historical standards. During the Hunt brothers-induced spike in 1980, silver reached an inflation-adjusted price of $143.54. In the 2011 bull market, driven by quantitative easing, it hit $68.04. Currently trading at just $33.70, silver has significant room to rise if it’s to catch up with these previous inflation-adjusted peaks.
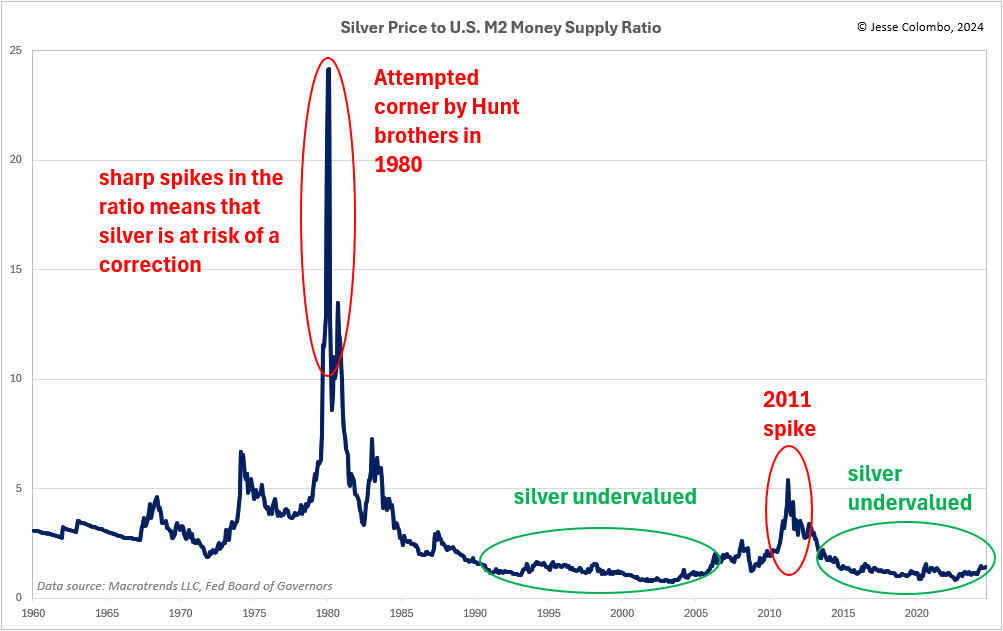
Another way to assess whether silver is undervalued or overvalued is by comparing it to various money supply measures. The chart below shows the ratio of silver’s price to the U.S. M2 money supply, providing insight into whether silver is keeping pace with, outpacing, or lagging behind money supply growth. If silver’s price significantly outpaces money supply growth, the likelihood of a strong correction increases.
Conversely, if silver lags behind money supply growth, it suggests a potential period of strength ahead. Since the mid-2010s, silver has slightly lagged behind M2 growth, which, combined with other factors discussed in this piece, positions it for a strong rally.
There is a high probability that silver will quickly run to $50 in the course of this rally. I’m focusing on $50 as a relatively short-term target because it’s a significant psychological level and the peak reached during both the 1980 and 2011 rallies.
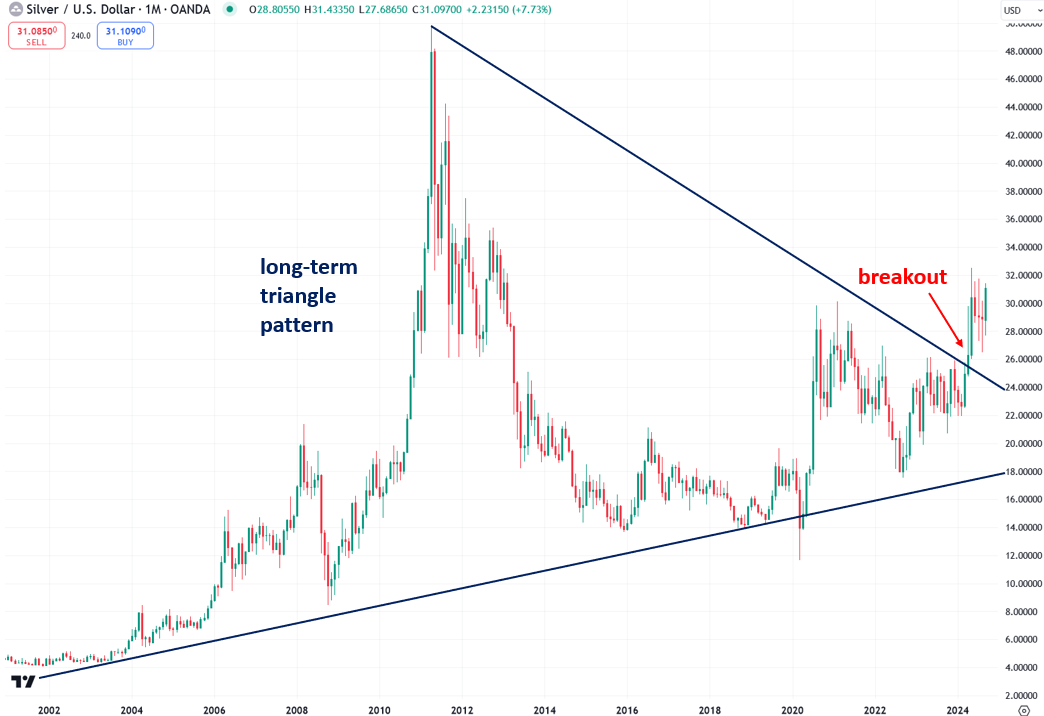
One of the reasons why I’m so bullish on silver is because its monthly chart reveals a recent breakout from a massive, two-decade-long triangle pattern. This breakout confirms that silver is on the verge of a powerful bull market:
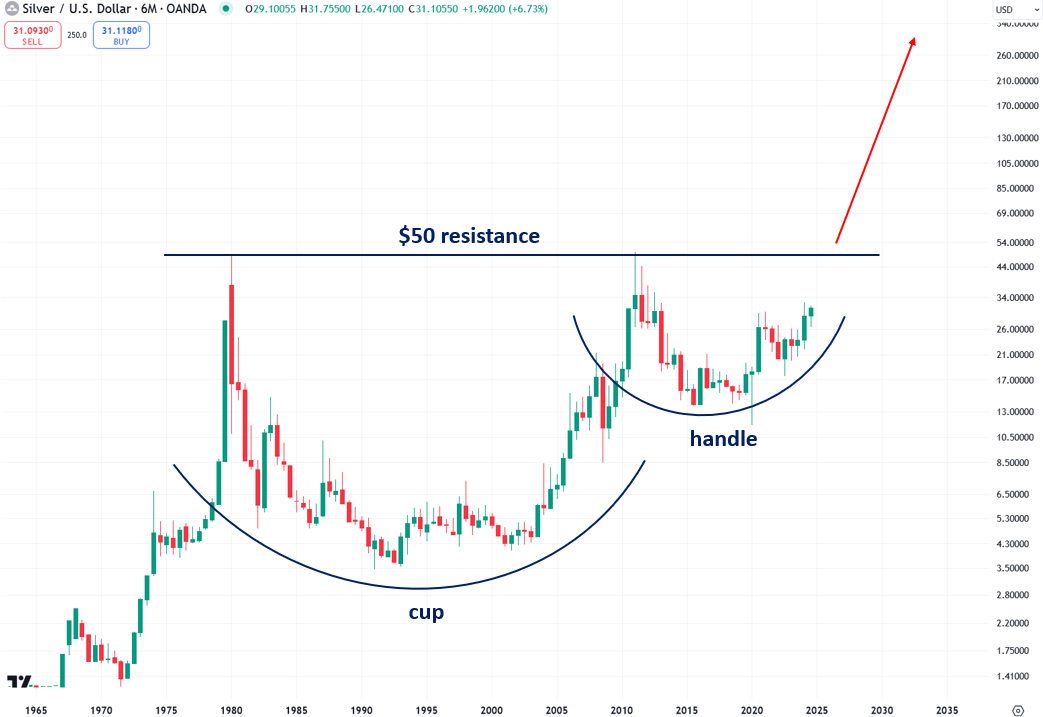
Even more exciting is the fact that silver’s logarithmic chart, dating back to the 1960s, reveals a cup-and-handle pattern, indicating the potential for silver to reach several hundred dollars per ounce during this bull market. In order to confirm this particular scenario, silver needs to close decisively above the $50 resistance level.
Earlier in this article, I mentioned that a significant portion of Friday’s silver buying volume was likely driven by short-covering. Short-covering happens when traders who have bet against an asset, like silver, through short-selling are forced to buy it back as the price rallies, in order to limit their losses.
As the asset’s price rises, these traders become increasingly desperate to buy it back to close their positions, which in turn fuels the rally even further. If the buying is aggressive enough, this can lead to a short squeeze, amplifying the upward momentum.
A key condition for a short squeeze is the presence of unusually heavy short positioning in the asset.
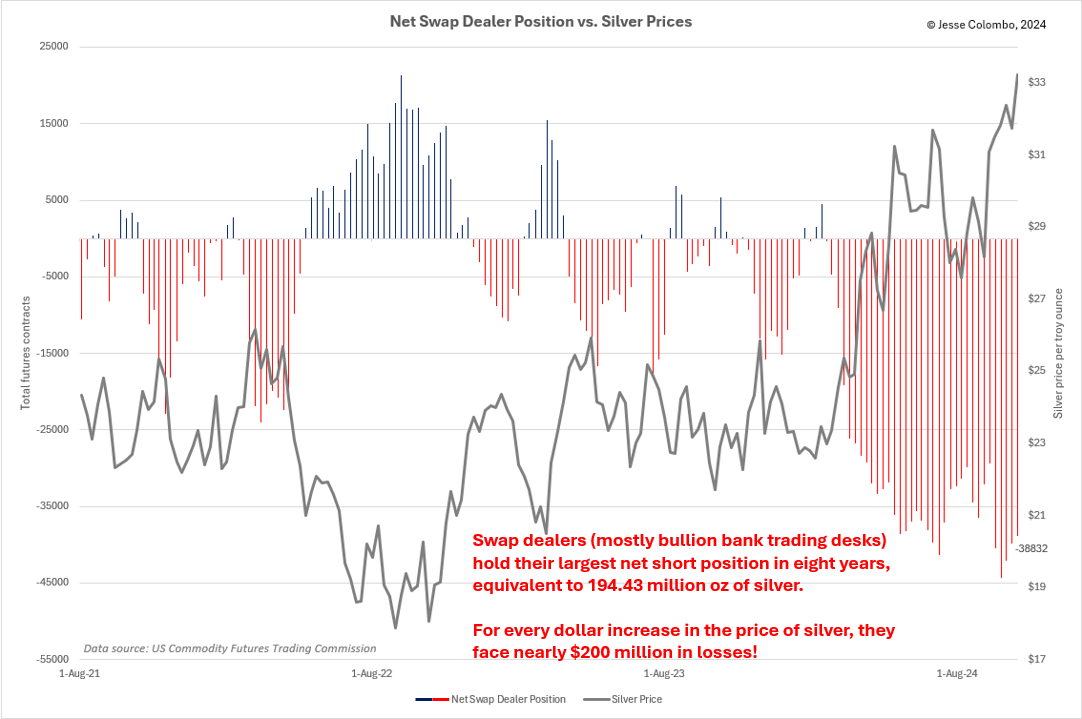
This is currently the case in COMEX silver futures, where swap dealers—mainly bullion bank trading desks—hold their largest net short position in eight years, totaling 38,832 contracts. This is equivalent to 194.43 million ounces of silver, or roughly 23% of the annual global silver production—a staggering figure.
Many analysts believe that bullion banks like JPMorgan and UBS are engaging in aggressive naked short-selling—dumping silver futures without actually holding the physical silver to back them up—in an effort to manipulate silver prices downward. There is a strong chance that these banks will end up on the wrong side of the trade as this rally continues, triggering a powerful silver short squeeze.
Given the current size of their short position, bullion banks face nearly $200 million in losses for every dollar increase in the price of silver. This means they lost nearly $400 million on Friday alone! Now, just imagine what will happen as silver climbs by $5, $10, $20, and beyond from this point.
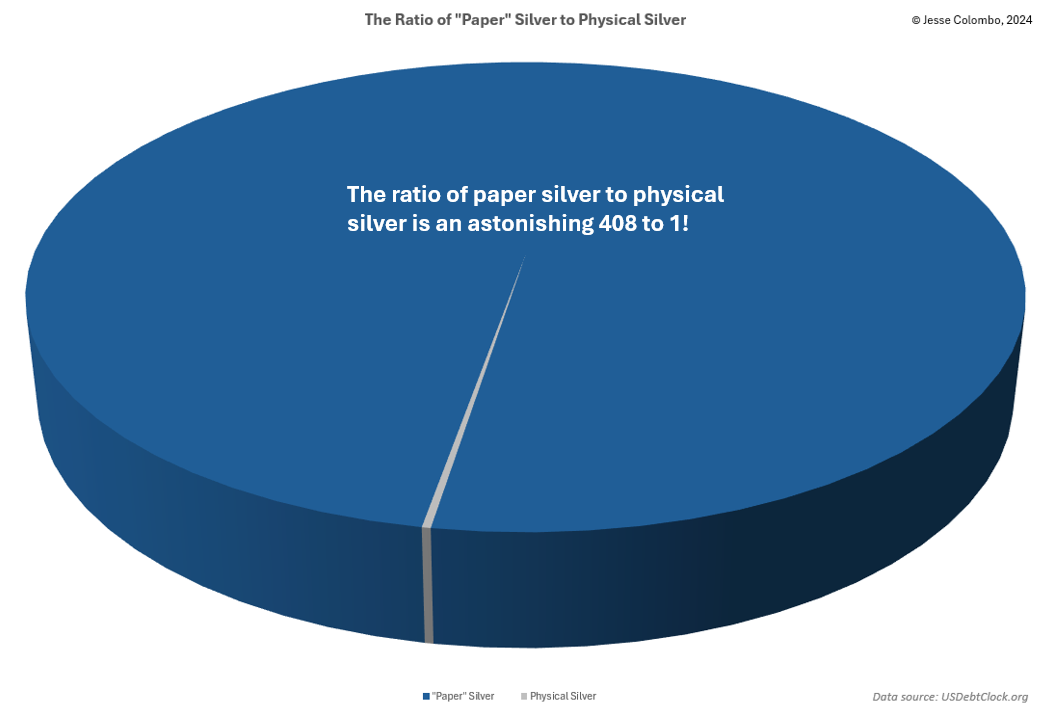
The risk of an explosive silver short squeeze is further amplified by the astonishing ratio of 408 ounces of “paper” silver—ETFs, futures, and other derivatives—for every single ounce of physical silver.
In a violent short squeeze, holders of “paper” silver could be forced to scramble for the extremely scarce physical silver to fulfill their contractual obligations. This would cause the price of “paper” silver products to collapse, while physical silver prices would skyrocket to jaw-dropping levels, potentially reaching several hundred dollars per ounce (this event is what may fulfill the price target implied by the cup and handle pattern I showed earlier).
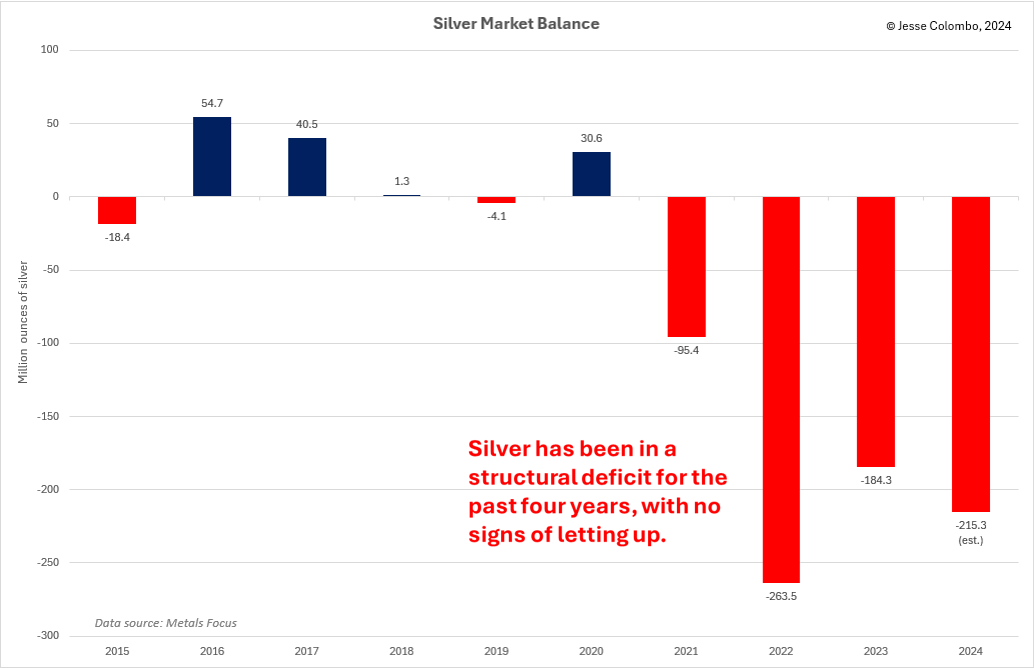
As if the technical outlook weren’t already bullish enough, silver’s fundamentals are just as compelling. Surging industrial demand, coupled with declining global mine production, has kept silver in a structural deficit for the past four years—and there’s no sign of relief on the horizon.
In 2023, the deficit reached 184.3 million ounces, with an even larger shortfall of 215.3 million troy ounces projected for 2024. The silver deficit in recent years has rapidly depleted above-ground supplies, tightening supply even further. This shrinking supply will intensify the impending silver short squeeze, driving an even more dramatic price surge.
Silver’s breakout on Friday marks a pivotal moment in its ongoing bull market, confirming many of the key conditions I’ve been highlighting for weeks. With silver decisively closing above the critical $32.50 resistance level and surging on high volume, the stage is set for a powerful rally. The technical and fundamental drivers behind silver are aligning, from the breakdown in the gold-to-silver ratio to surging demand and shrinking supply.
The looming threat of a short squeeze, combined with silver’s structural deficit, suggests that the price could climb significantly higher, potentially reaching levels not seen in decades. As silver continues its upward trajectory, the potential for explosive gains has never been clearer.
Jesse Colombo is a financial analyst and investor writing on macro-economics and precious metals markets. Recognized by The Times of London, he has built a reputation for warning about economic bubbles and future financial crises. An advocate for free markets and sound money, Colombo was also named one of LinkedIn’s Top Voices in Economy & Finance. His Substack can be accessed here.