
(Mike Maharrey, Money Metals News Service) Stocks have taken a beating over the last several days. The conventional wisdom is that the sell-off is due to worries about the impact of the Trump tariffs.
The aggressive tariff regime certainly triggered the sudden and sharp downturn in the stock market, but is something deeper going on?
I think there is.
The big sell-off in response to tariffs is just one chapter in a much longer novel. A look at a metric known as the Dow-to-gold ratio hints at the larger narrative.
In a nutshell, the stock market is historically overvalued. In other words, it is a bubble. And one thing we know about bubbles is that they eventually pop.
All it takes is a pin.
Tariffs might be the pin.
But even if stocks manage to regain their footing, another pin is out there.
What Is the Dow-Gold Ratio?
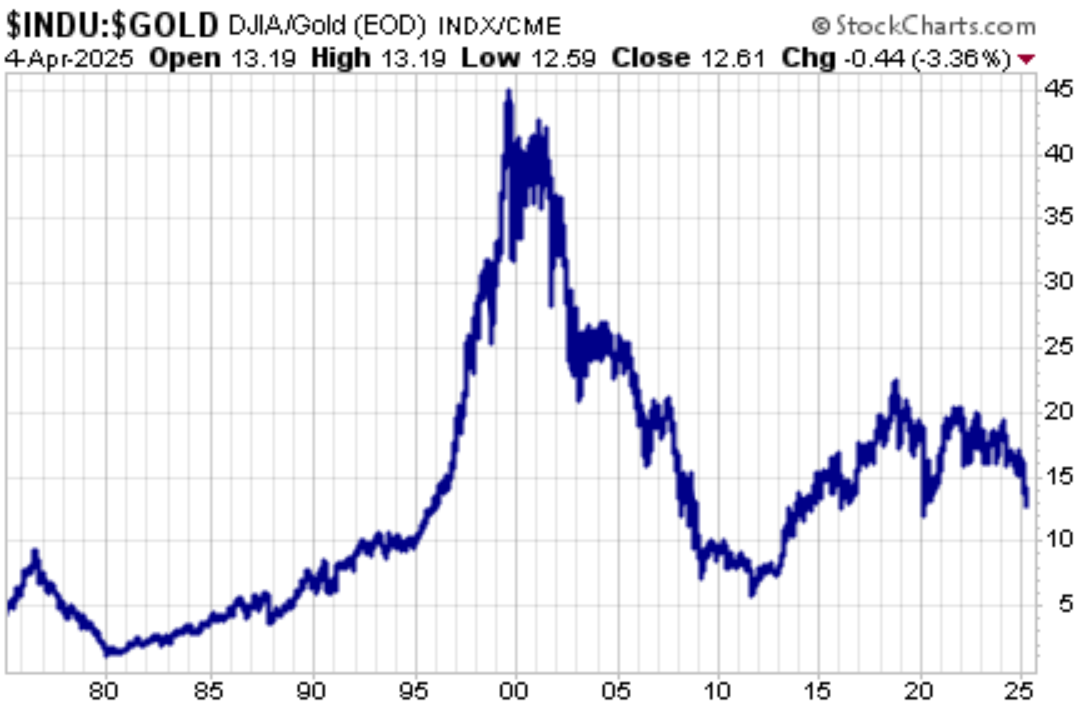
The Dow-to-Gold ratio prices the Dow Jones Index in ounces of gold. Currently, the ratio stands at just over 12.5-1. In other words, it would take around 12.5 ounces of gold to “buy” the Dow.
As you can see from the chart, the ratio is starting to break down.
What is this telling us?
Ratios are valuable in revealing trends and cycles. For instance, a large spread in the gold-to-silver ratio (such as the 100:1 ratio today) tells us that silver is significantly undervalued compared to gold. When we get these large spreads, ratios typically revert back to the mean. For instance, the gold-to-silver ratio fell to 30-1 in 2011 after rising to over 80-1 during the money creation of the Great Recession in the wake of the 2008 financial crisis.
We can track similar trends in the Dow-to-gold ratio.
What we find is that historically, a falling Dow-to-Gold ratio precedes or coincides with financial crises or long-term bear markets.
Going way back in time, the ratio fell from around 18-1 to 2-1 in the early years of the Great Depression.
During the stagflationary years of the ’70s, stocks tanked, but gold took off on a long bull rally. In 1980, the Dow-Gold ratio briefly touched 1-1.
As we can see from the chart, stock valuations took off in the 90s. Between that low in 1980 to 2000, the index moved as high as 43-1.
How do we account for this massive runup in stocks?
There were certainly many factors, but one of the most significant drivers was money creation by the Federal Reserve that helped pump up the dot-com bubble. The extreme overvaluation of tech stocks drove the Dow-to-gold ratio to all-time highs.
And then the bubble popped.
The Fed managed to keep some air in the bubble for a while with a massive injection of easy money, but the bubble popped as we endured the 2008 financial crisis and the Great Recession. Between 2000 and 2011, the ratio fell to as low as 6:1.
And then the Fed went to work again.
The Dow-to-gold ratio peaked at over 18:1 in 2018, thanks to a decade of easy money. The ratio fell modestly in late 2018 as the stock market tanked and the central bank finally attempted to “normalize” monetary policy. But when the market crashed in the fall of that year, the central bank pivoted back to quantitative easing to keep the air flowing.
The pandemic gave the Fed cover to double down on loose monetary policy and blow even more air into the stock market bubble. The chart shows the post-pandemic rebound as stocks surged due to massive liquidity injections inflating the ratio yet again.
Since then, we’ve seen a relatively steady ratio until the drop in recent weeks.
Bubbles Pop
The relationship between Federal Reserve monetary policy and the Dow-to-Gold ratio underscores an important fundamental — the stock market is subject to inflation just like consumer prices. In fact, monetary inflation often shows up in equities first. In a nutshell, central bank money creation tends to blow up asset bubbles.
In effect, this means that while stocks have surged in nominal terms, they have made much less progress in real (inflation-adjusted) returns.
I have been saying for years that the stock market is extremely overvalued, thanks to the Fed’s monetary malfeasance. It is a bubble waiting for a pin. It started to deflate in 2018, but the Fed was able to use the pandemic as an excuse to pump the air back in. Now, it may have found its pin in Trump tariffs.
There is little question that the stock market is extremely overvalued. In December, CurrentMarketValuation.com called the S&P 500 “strongly overvalued” based on the price-earnings ratio.
If history is any indication, the sudden drop in the Dow-to-Gold ratio could be signaling the beginning of a massive selloff in stock and a major rally in gold.
An Opportunity for Investors
The recent breakdown in the Dow-to-gold ratio may signal that it’s time to consider getting out of stocks and into gold.
Even if Trump backs off the aggressive tariffs and provides some relief for markets, it won’t change the fact that stocks are overvalued. We still haven’t dealt with the ramifications of well over a decade of artificially low interest rates and multiple rounds of QE.
We will.
Consider this: if the Dow-gold ratio were to revisit the 1-1, we’d be looking at either a massive stock market crash, an explosive move higher in precious metals prices, or some combination of both.
While a return to a 1-1 ratio would be extreme, even a more modest contraction of the ratio presents an opportunity. If the ratio returned to 5-1, we’d be looking at $7,500 gold if there was no corresponding drop in the Dow. If the Dow fell to 20,000, gold would still be over $4,000 an ounce.
And don’t forget that silver typically outperforms gold in the latter part of a gold bull market. With the gold-to-silver ratio over 100-1, we know that silver is significantly undervalued compared to gold and set up for a major gain. So this extremely high gold-to-silver ratio suggests one might be overweight to silver in comparison to gold.
Nobody has a crystal ball. Trump could relent on tariffs tomorrow and set off a relief rally in stocks. But it won’t change the fact that the market is a “big, fat, ugly bubble,” to quote Donald Trump in 2016. Smart investors are positioned for that reality.
Mike Maharrey is a journalist and market analyst for Money Metals with over a decade of experience in precious metals. He holds a BS in accounting from the University of Kentucky and a BA in journalism from the University of South Florida.