
(Mike Maharrey, Money Metals News Service) Silver has taken us on a wild ride, nearly doubling in price this year. However, some analysts worry that silver is taking us down a path of disappointment. They base their bearish sentiment on history. After all, silver teased us with twin records in 1980 and 2011 before quickly selling off both times.
As such, there is a lot of jitteriness out there, reflected in silver’s current price volatility. Some traders are concerned that we will see a rapid selloff of silver as we did after the metal broke $48 an ounce in 1980 and 2011.
Will history repeat?
Sprott Money analyst Craig Hemke doesn’t think so. He says this time is different.
“The situation economically, monetarily, and physically is entirely different from 1980 and 2011.”
Hemke doesn’t expect silver to follow Grandfather’s path in the 80s or Pappa’s path in 2011. He thinks the setup looks more like Uncle Gold’s trajectory over the last couple of years.
A Silver History Lesson
So, what happened in 1980 and 2011?
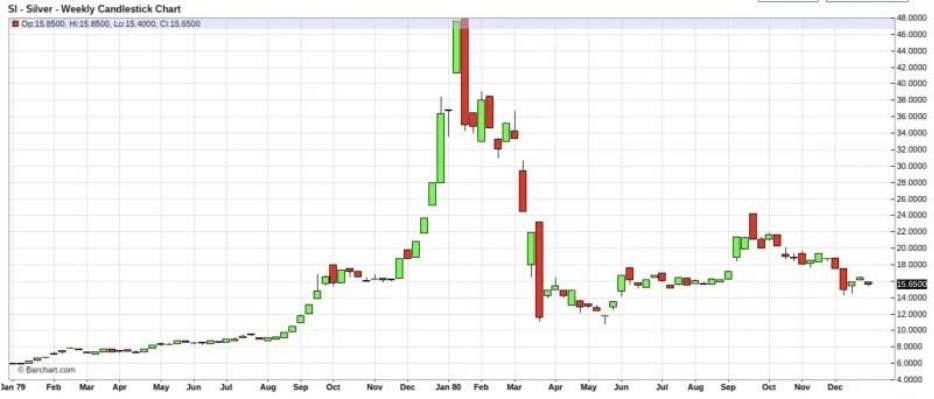
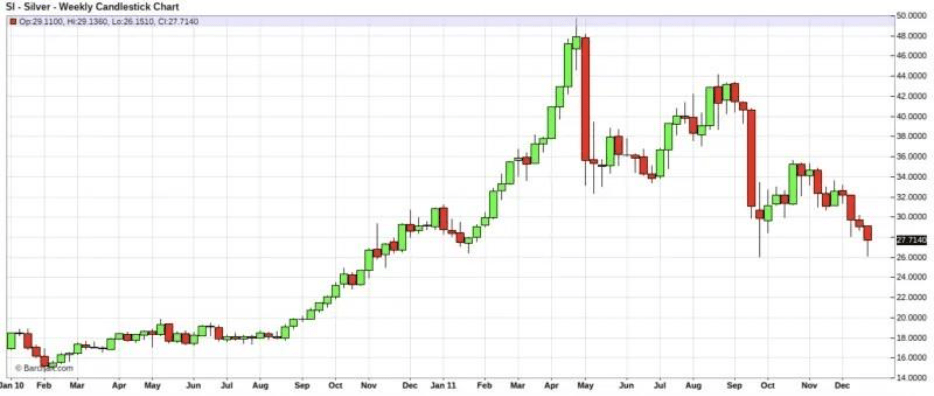
In both cases, silver soared quickly over $48 and then fell back to earth even faster.
In 1980, the silver price moved from $10 an ounce to $48 in just four months. Two months later, it was back at $10.
Starting in late 2010, silver rallied again, hitting $48 in eight months. But again, it quickly gave up those gains, falling to $26 in just a few months.
This time does look different. Silver hit $48 on October 3 and closed above $50 for the first time the following week. It consolidated briefly around $48, testing the level several times before taking off again in recent weeks.
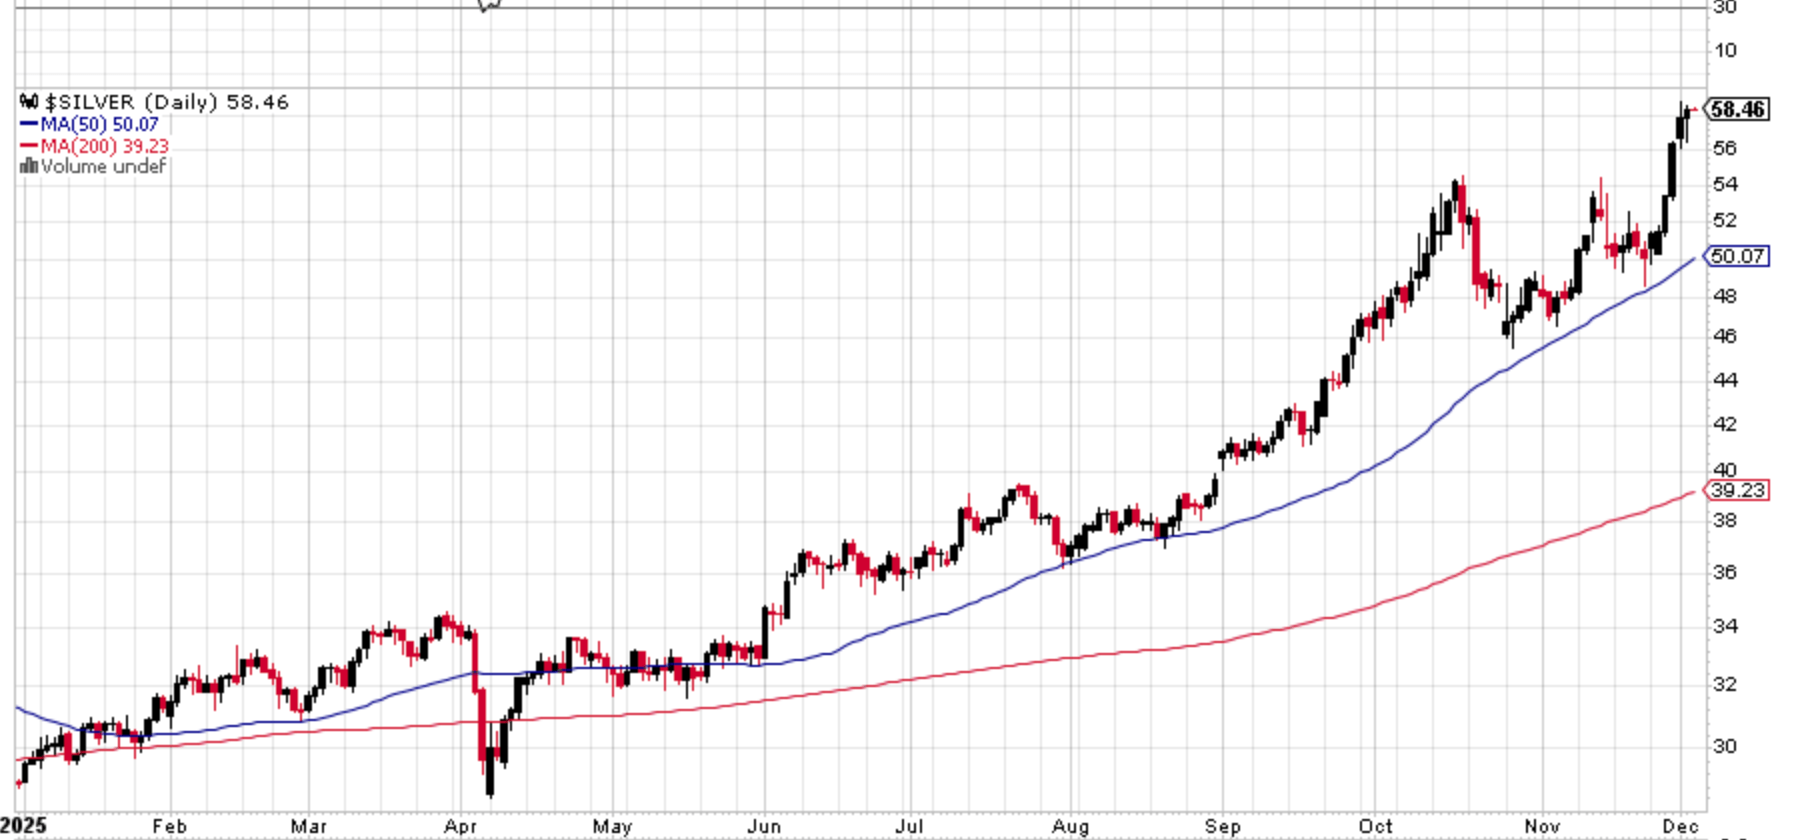
The fact that silver has held $48 this long differentiates this rally from those in 1980 and 2011.
Some have declared that silver has charted a double top this year, a bearish indicator. But Hemke points out that to confirm a double top, silver would need to fall through $46.
“Until then, two peaks at the same level denote a trading range and consolidation—nothing more.”
Look at Gold
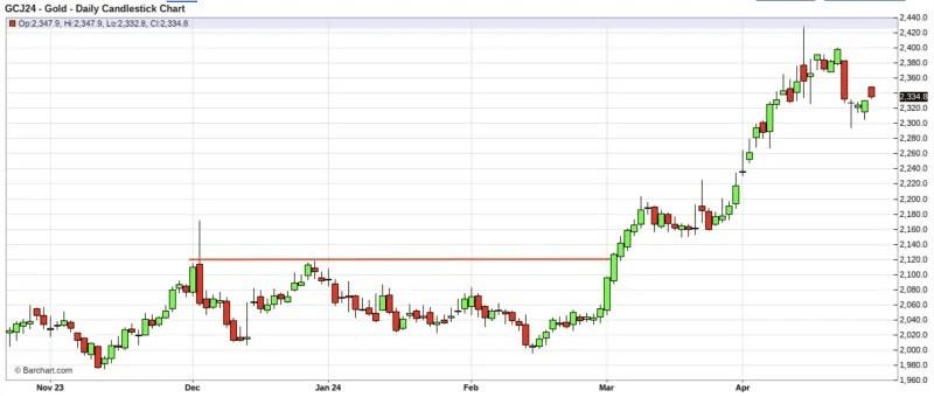
Hemke believes the price pattern playing out is similar to gold’s breakout in 2023 and 2024 than the silver bull markets in 1980 and 2011.
As you might recall, gold finally cracked strong resistance at $2,000 an ounce in December 2023 and surged to $2,100. Then we saw a sharp reversal. Just 17 days later, gold eclipsed $2,100 again before once again selling off. Over the next several months, gold was rangebound in the $2,000 an ounce range before breaking out and surging higher again in March 2024.
When gold bounced off $2,100 twice in a matter of weeks, a lot of experts declared it a double top and false breakout. As Hemke pointed out, these experts were proven wrong. It was merely a period of consolidation and range-bound trading.
“The gold price had not topped and, instead, was simply basing in a consolidation range. The true breakout came 90 days later in early March of 2024.”
Hemke believes there is a similar technical setup for silver. He wrote this in late September.
“I expect the price action in silver over the next few weeks to somewhat mirror the gold price action seen in late December 2023 into early 2024. A rally to the $48-50 all-time highs, a sharp reversal, and a few more failed attempts at a breakout before the final and official breakout occurs. Let’s refer to that gold chart from late 2023 as our silver analog.”
Looking ahead, we may well see further consolidation and a period of sideways trading. But Hemke believes the true breakout for silver remains in the future.
“t is not 1980 and it’s not 2011 either. The silver price is not about to collapse, and it did not just paint a double top. Instead, just like gold two years ago, the silver price is consolidating and basing near and just above its old all-time highs with the true breakout pending for early 2026.”
Hemke says a breakout next year will likely push silver to new all-time highs.
“The gold price has doubled since it broke out in March of 2024, and a similar move in silver will take price to $100/ounce by mid-late 2027.”
Not Enough Silver!
The fundamentals support Hemke’s technical analysis. Supply and demand dynamics remain extremely bullish for silver.
Many analysts claim the movement of silver from London to New York last spring, due to tariff worries, set the stage for the record run by silver in October. As demand picked up, particularly in India, traders scrambled to find available metal. A rapid shift of silver from New York to London eased the squeeze, but it didn’t solve the underlying problem.
It’s not that there’s not enough metal in London. The problem is there isn’t enough metal, period.
This isn’t a problem that can be solved by moving metal from one warehouse to another. The issue is that demand has outstripped supply for several years.
According to Metals Focus, silver is on track for its fifth straight structural market deficit.
Metals Focus projects demand will outstrip supply by 95 million ounces this year. That would bring the cumulative 5-year market deficit to 820 million ounces, an entire year of average mine output.
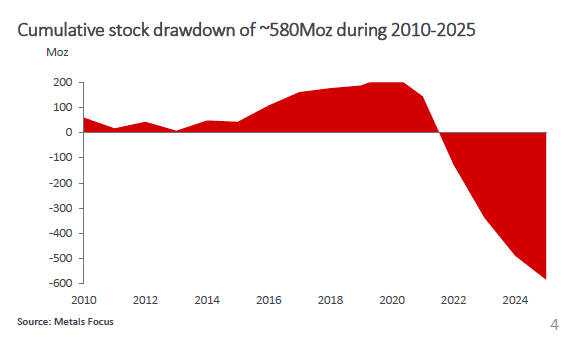
Since 2010, the silver market has accumulated a supply deficit of over 580 million ounces.
To make up the supply deficit, silver users will have to draw from existing above-ground stocks. That will likely require higher prices.
The Federal Reserve’s pivot to easy money and lower interest rates will also likely support silver in the year ahead.
When you put the technicals and fundamentals together, there is no reason to turn bearish on silver, 1980 and 2011 notwithstanding.
Mike Maharrey is a journalist and market analyst for Money Metals with over a decade of experience in precious metals. He holds a BS in accounting from the University of Kentucky and a BA in journalism from the University of South Florida.