")
(Jesse Colombo, Money Metals News Service) Gold has momentarily paused just below $3,000, catching its breath while building momentum for its next move. With energy accumulating, a breakout above $3,000 could be just around the corner.
Gold has been on an impressive run lately, making life easy for us gold investors—a great problem to have! Now, it’s all about monitoring its progress, watching key levels, and being aware of the fundamentals pointing to even higher prices.
As gold climbs, expect more naysayers—likely those who missed the rally—claiming it has risen too far, too fast, and is due for a drop. But that’s just part of a classic bull market, which always climbs a ‘wall of worry.’
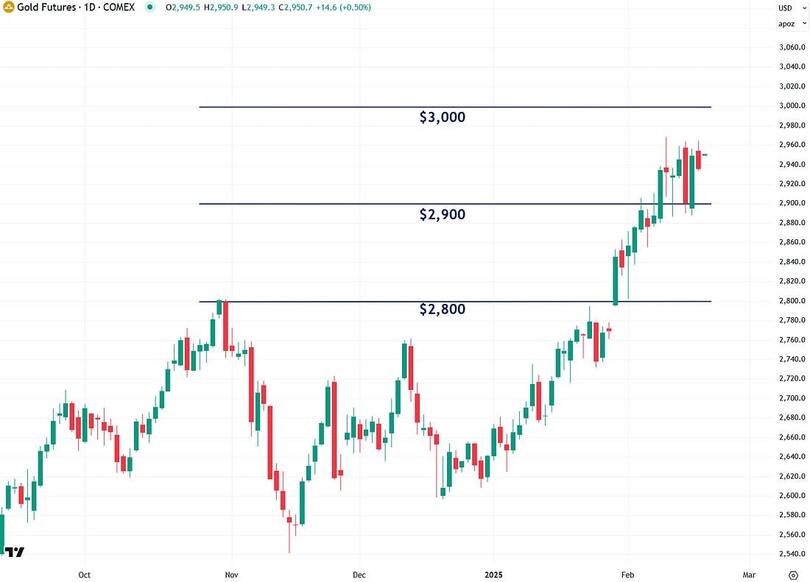
Starting with the basics, as I’ve mentioned before, I closely watch $100 increments in COMEX gold futures because they often act as key support and resistance levels. For example, $2,800 marked the peak in late October, and once gold broke above it about a month ago, it signaled a strong bullish breakout.
Tracking these key levels isn’t voodoo or pseudoscience—it has a solid logical basis. These price points hold significant psychological value, with investors closely watching them and placing stop and limit orders around them more than at other random levels.
Additionally, they often align with strike prices in the options market that see the highest activity. The combination of these factors is why these $100 increments frequently serve as important floors and ceilings in gold.
As you can see from the chart below, gold has broken above both $2,800 and $2,900—an encouraging sign. Last week, gold tested the $2,900 support multiple times, including during Friday’s sharp pullback, and each time, it rebounded quickly.
This kind of resilience is a strong indicator of gold’s underlying strength.
Right now, I want to see $2,900 hold as support, with the next key hurdle being gold’s push toward—and eventual breakthrough of—$3,000, a level of major psychological significance and strong resistance.
There’s a high probability this will happen because round numbers like $3,000 tend to act as price magnets, drawing asset prices toward them.
If gold can close convincingly above $3,000, we enter serious ‘blue sky’ territory, where there’s no significant resistance overhead. That’s when I believe we’ll see a parabolic surge—one far more aggressive than anything we’ve witnessed so far. I’m talking about massive $100 up days as momentum accelerates.
An interesting and encouraging development in gold over the past week is the formation of a potential bull flag pattern—a continuation pattern that signals further gains upon a confirmed breakout.
However, for this to be valid, gold must break out to the upside with strong volume. I take a rather-than-predictive approach in these scenarios, waiting for confirmation before making conclusions.
If this pattern successfully plays out, it would provide the momentum gold needs to slice through $3,000.
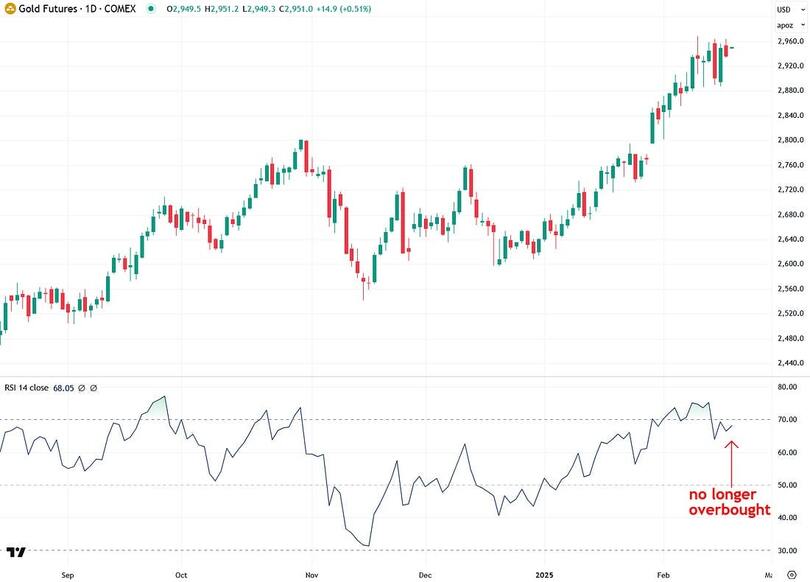
After gold’s sharp rally since the start of the year, it became overbought according to the widely followed Relative Strength Index (RSI), a key momentum indicator. While this is typical behavior in bull markets and a sign of strength, it often signals a period of consolidation to ease the overbought condition.
Fortunately, the recent pause over the past week has helped moderate this extreme, which is a positive sign. Gold may need a bit more time to consolidate further and cool off before making its next push toward $3,000+.
Gold miners are gaining momentum, though not as quickly as gold itself. That’s perfectly fine. I remain highly optimistic about them, but it may take gold surpassing $3,000 for sentiment to truly ignite.
It’s also important to recognize that gold’s bull market has been largely fueled by Asian central banks and investors, while Western investors have yet to join in. Instead, they’ve been preoccupied with chasing ‘Fartcoin’ and Dot-com Bubble 2.0 stocks—assets that are destined to implode.
Most gold mining stocks and ETFs trade on Western exchanges, meaning their lackluster performance so far is simply a reflection of Western investors’ disinterest in gold. However, I expect that to change very soon.
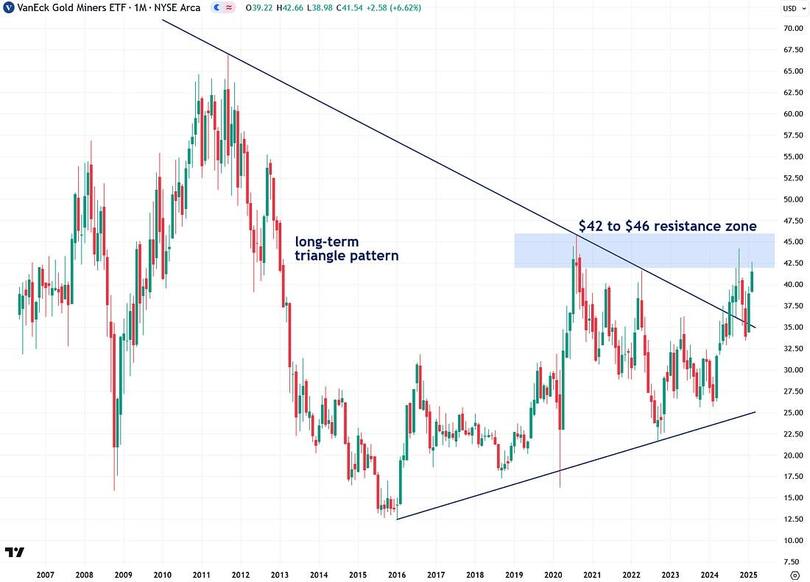
The large-cap VanEck Gold Miners ETF (GDX) broke out of a long-term triangle pattern about a year ago—a strong signal that a major bull market is underway. Now, for this rally to gain real momentum, GDX needs to decisively close above the key $42 to $46 resistance zone overhead.
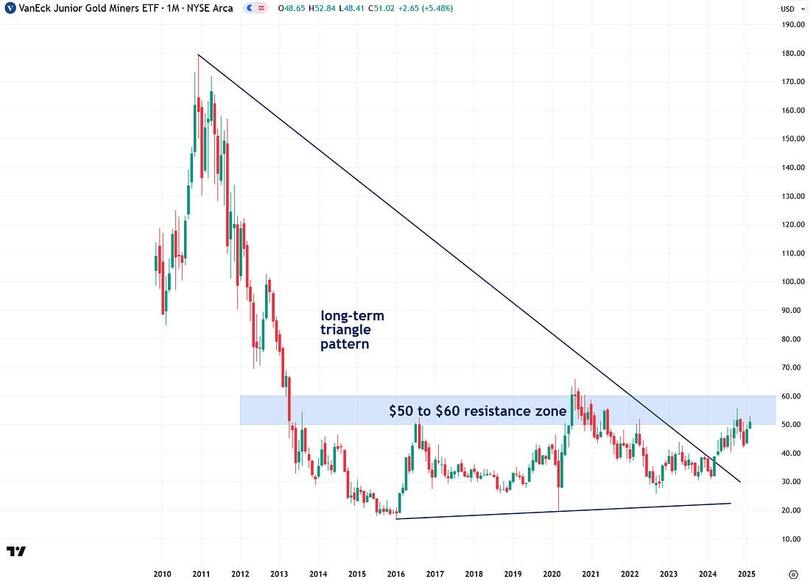
Likewise, the VanEck Junior Gold Miners ETF (GDXJ) broke out of a long-term triangle pattern in early 2024, signaling the start of a new bull market.
For full confirmation, I’m now watching for a decisive close above the key $50–$60 resistance zone, which would solidify the bullish trend and open the door for much further upside.
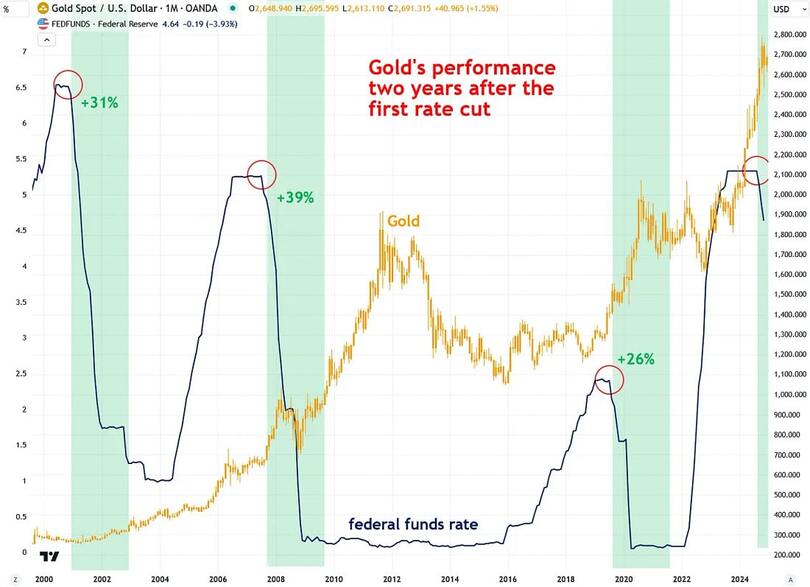
One of the many signs that gold’s bull market still has plenty of upside is its historical performance following the first Fed funds rate cut in a rate-cutting cycle.
If gold follows the pattern of the last three cycles, it suggests a climb from $2,940 (at the time of writing) to around $3,380.
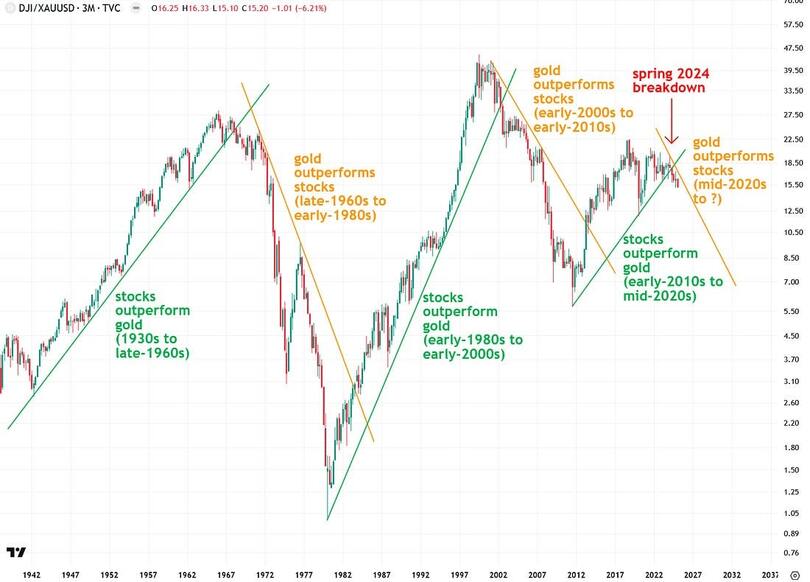
Another key reason gold’s bull market is still in its infancy is the massive bubble in the U.S. stock market, which will end in a significant bear market. This downturn will lead to a substantial transfer of capital from stocks into gold.
Notably, the Dow-to-Gold ratio broke below its uptrend line in the spring of 2024, signaling that the rotation of capital from stocks to gold has already begun. This shift will gain momentum as the stock market bubble inevitably bursts.
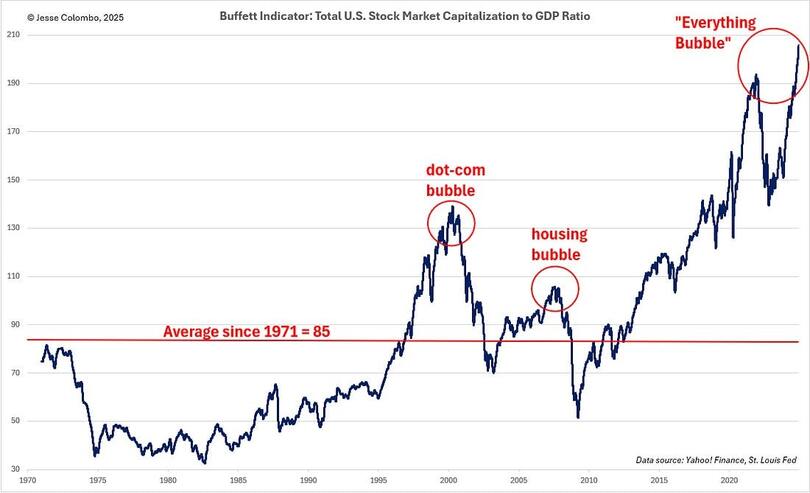
Gold still has an enormous amount of fuel left to propel it to $5,000, $10,000, or even $15,000 and beyond. One key factor is that the U.S. is currently experiencing the largest stock market bubble in history by several measures—including the total U.S. stock market capitalization-to-GDP ratio.
This metric, often called the ‘Buffett Indicator,’ has been described by Warren Buffett himself as ‘the best single measure of where valuations stand at any given moment.’ With the equity market stretched to extreme valuations, gold’s upside potential remains massive.
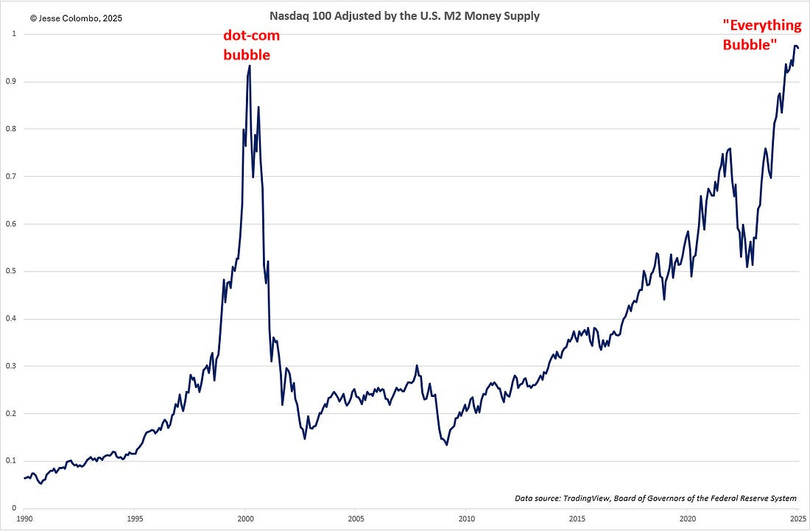
If the Buffett Indicator isn’t enough to convince you, consider the Nasdaq 100 adjusted for the U.S. M2 money supply.
This metric reveals that we’re in a bubble even worse than the late 1990s dot-com bubble, which ended in disaster. While that’s a terrifying prospect for tech stock investors, it’s fantastic news for precious metals investors.
In summary, gold remains in a strong technical position, and I’m watching for it to break out of its recent bull flag pattern and make a run for $3,000. A decisive close above this level would confirm the breakout and likely propel gold’s bull market into a much more powerful phase.
Beyond the technicals, gold still has plenty of room to run, fueled by the looming burst of the U.S. stock market bubble. When that happens, we can expect a significant capital rotation from equities into gold, silver, and mining stocks.
This is an incredibly exciting space to be in, so buckle up and enjoy the ride!
Jesse Colombo is a financial analyst and investor writing on macro-economics and precious metals markets. Recognized by The Times of London, he has built a reputation for warning about economic bubbles and future financial crises. An advocate for free markets and sound money, Colombo was also named one of LinkedIn’s Top Voices in Economy & Finance. His Substack can be accessed here.