
(Mike Maharrey, Money Metals News Service) Silver is up an impressive 39.7 percent so far this year, hitting the highest level since 2011. It has broken through the significant $40 per ounce resistance and appears to be on track for a new record high over $50.
Yet, even with this bullish action, silver is still underpriced compared to gold.
As of the morning of September 9, the gold-silver ratio was still over 88-1. This indicates that silver remains a bargain compared to gold.
The gold-silver ratio represents the amount of silver it takes to buy one ounce of gold. In the modern era, the gold-silver ratio has averaged between 40-1 and 60-1. When it rises far above that level, it tends to snap back quickly to that mean.
The chart below reveals this phenomenon. Although the ratio has run at a higher average since the U.S. government demonetized silver in 1964, we still see sharp returns to the mean when the gold-silver ratio gets out of whack.
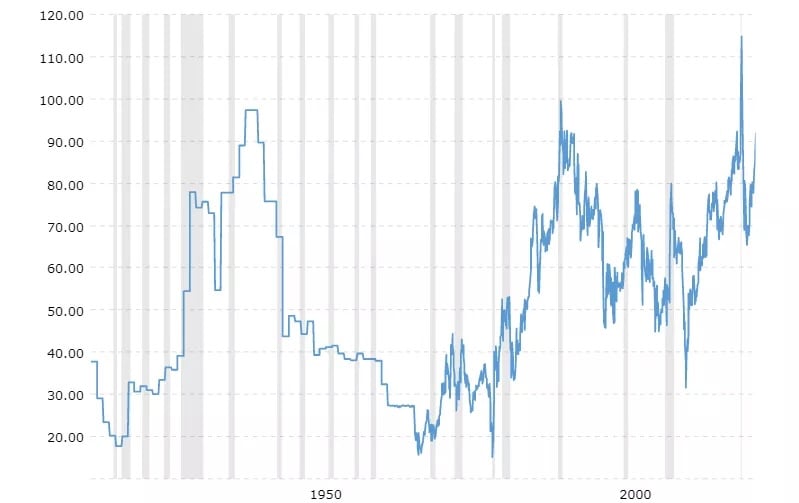
This typically happens when the price of silver rallies to close the spread. For instance, the gold-silver ratio fell to 30-1 in 2011 after rising to over 80-1 during the money creation of the Great Recession in the wake of the 2008 financial crisis.
In a more recent example of this snap-back, the gold-silver ratio set a record of 123-1 as Covid hysteria gripped the world and then plunged to around 60-1 as central banks around the world cranked up the money creation machine to cope with governments shutting down economies. From its June 2020 low, silver gained 80 percent in less than 20 weeks.
From a historical perspective, when you see gold-silver ratios well above the historical average, it tells you that silver is underpriced compared to gold, and there is a strong possibility that silver will go on a bull run to close that gap. Historically, this has often happened in the midst of a gold bull rally, with silver outperforming gold. (Of course, past performance does not guarantee future results.)
Silver Bull Market Strength
Beyond the price discrepancy between gold and silver, there are plenty of indications that this silver bull market has plenty of legs left.
Most significantly, the supply and demand dynamics will likely put continued upward pressure on the price.
Demand outstripped the silver supply for the fourth consecutive year in 2024. The structural market deficit came in at 148.9 million ounces. That drove the four-year market shortfall to 678 million ounces, the equivalent of 10 months of mining supply in 2024.
When demand outstrips mining and recycling output, industrial users of the metal are forced to wade into the market to access existing stocks of silver. This pushes the price higher.
Industrial demand set a record for the fourth straight year in 2024.
Meanwhile, investment demand has been somewhat subdued despite the price surge. This is primarily due to the fact that American investors have largely remained on the sidelines.
Silver Institute data shows that weak demand in the physical silver investment market is almost entirely being driven by Americans. Asian demand has been robust – especially in India, as already noted. European silver demand has shown signs of recovery, although it is coming off a relatively low base.
However, in the U.S., we’ve seen investors taking advantage of higher prices and selling to take a dollar profit. This is similar to the dynamic in the gold market, where U.S. investors have also remained on the sidelines.
According to the Silver Institute, retail silver investment is down about 30 percent in the U.S.
When U.S. investors finally get into the game, it could drive silver prices even higher.
The bottom line is that, given the fundamental dynamics and the technical charts, $40 silver still looks like a steal.