(Jesse Colombo, Money Metals News Service) While silver has been relatively quiet in recent weeks following its encouraging breakout, this doesn’t signal failure—rather, it looks like a healthy pause typical of low-volume summer trading.
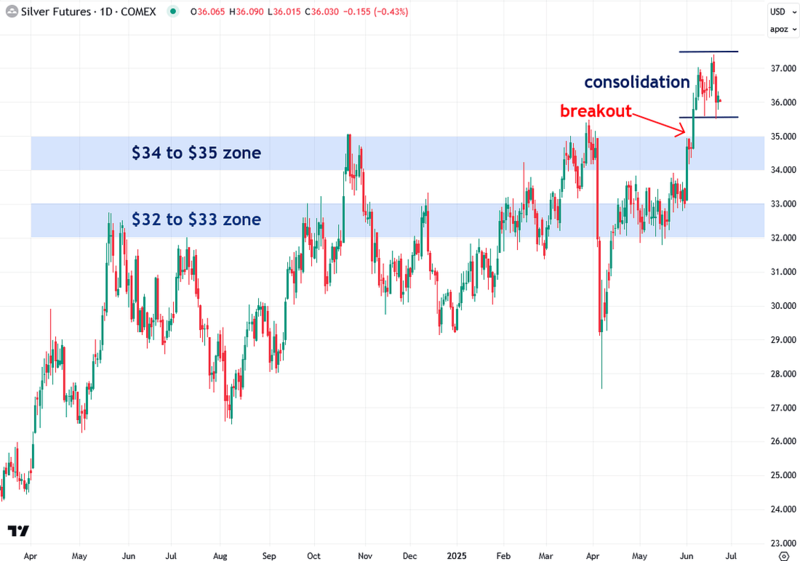
On June 5th, silver finally broke above both the $32–$33 and $34–$35 resistance zones that had capped its upside for the past year, frustrating many silver bulls, including myself.
Despite that stagnation, this breakout is a strong confirmation of that outlook. While silver has since paused, leading some to question the move, I believe it’s likely just consolidating before its next leg higher. In this update, I’ll cover where silver and key related assets stand now, what to watch for, and what’s likely coming next.
Let’s start with the basics: the COMEX silver futures chart, which I closely monitor because it tends to respect $1 increments as key support and resistance levels. Two major resistance zones had capped silver’s progress for much of the past year—$32 to $33 and $34 to $35—until the breakout in early June finally pushed prices through those barriers.
That breakout drove silver as high as $37 before it pulled back slightly to the $36 area. This dip has been driven in part by weakness in related assets like gold and copper, as well as mounting geopolitical tensions involving Israel, Iran, and now the U.S. entering the picture. Unlike gold, which is purely a precious metal and safe haven, silver also responds to industrial demand and economic shifts, making it more sensitive to both fear and economic risk.
Still, despite this modest retreat, the breakout remains intact and technically strong. For now, I view the recent price action as a healthy consolidation. I’m not concerned—but I am watching closely for further confirmation, which I’ll detail in the next set of charts.
I’ve also developed a proprietary indicator called the Synthetic Silver Price Index (SSPI), designed to help validate silver’s price action and filter out potential false breakouts.
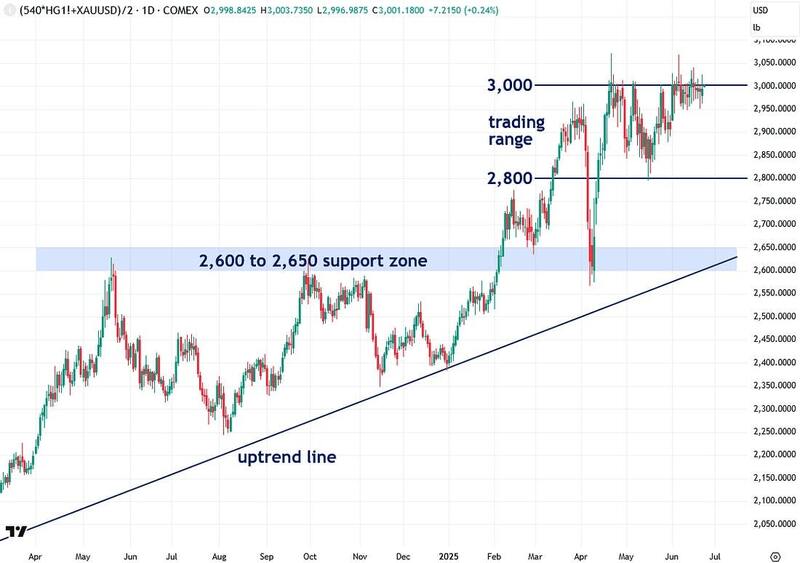
The SSPI is calculated as the average of gold and copper prices, with copper scaled by a factor of 540 to prevent gold from dominating the index. Interestingly, even though silver isn’t part of the calculation, the SSPI closely tracks its movements.
Since March, the SSPI has been trading in a consolidation range between 2,800 and 3,000. I believe that a decisive breakout above the 3,000 level would serve as yet another bullish confirmation for silver, as strength in both gold and copper would provide a supportive tailwind, making it increasingly difficult for silver to stay suppressed.
While the SSPI has made several breakout attempts, it has yet to push through—but that’s no cause for concern. Consolidations and trading ranges are a normal part of healthy bull markets, especially during the quieter summer months when trading activity and news flow typically slow as Wall Street heads out on vacation. I’m continuing to monitor this closely and will be watching for that eventual breakout.
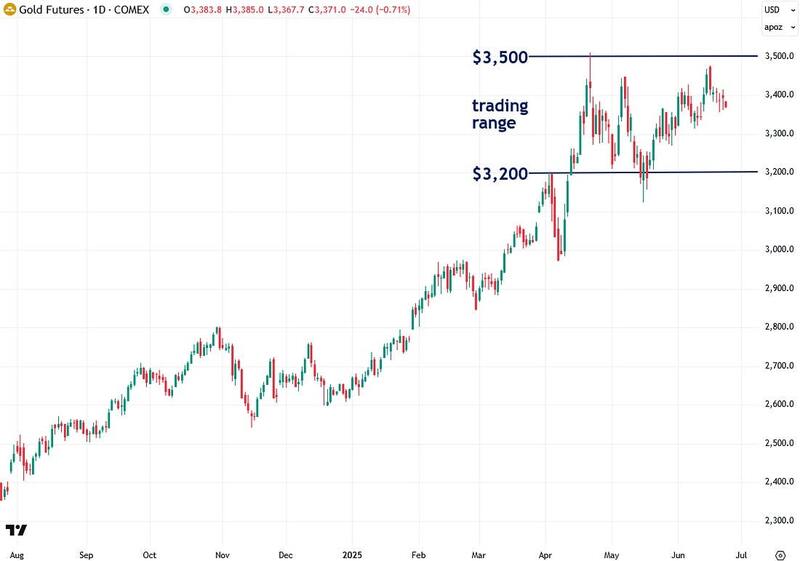
I also like to examine the individual components of the Synthetic Silver Price Index—gold and copper—to get a better sense of where the index, and therefore silver, might be headed next. As I’ve been explaining, gold has been consolidating for the past two months, just as I expected, after briefly touching the key $3,500 resistance level before pulling back.
This consolidation is both normal and healthy following such a strong bullish run, especially during the typically quiet summer months when trading volume tends to decline. In fact, a similar pattern played out last summer before gold resumed its rally in the fall. I’ll continue to monitor this consolidation closely and keep you updated on how it unfolds.
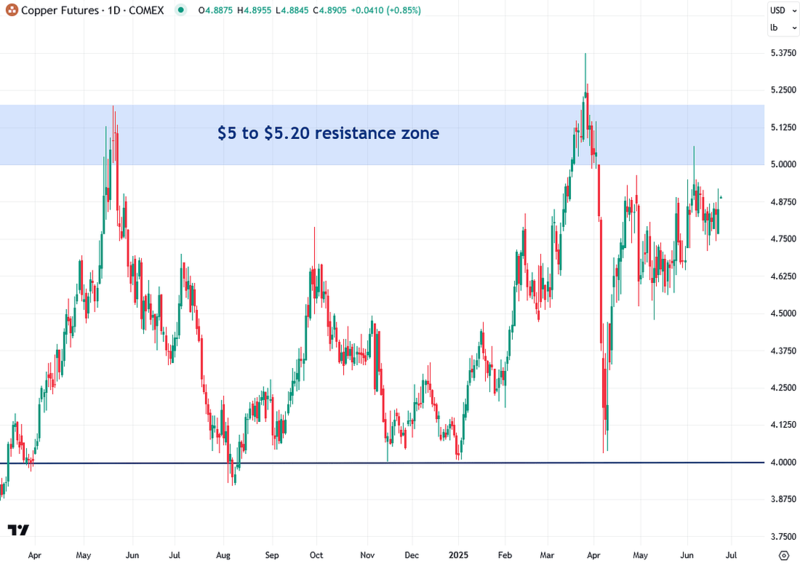
Copper futures continue to consolidate but are holding firm just below the key $5.00 to $5.20 resistance zone. A decisive breakout above that level would contribute to a broader breakout in the SSPI, adding further bullish momentum to silver. There are also several compelling reasons to be bullish on copper, as I outlined in a recent report.
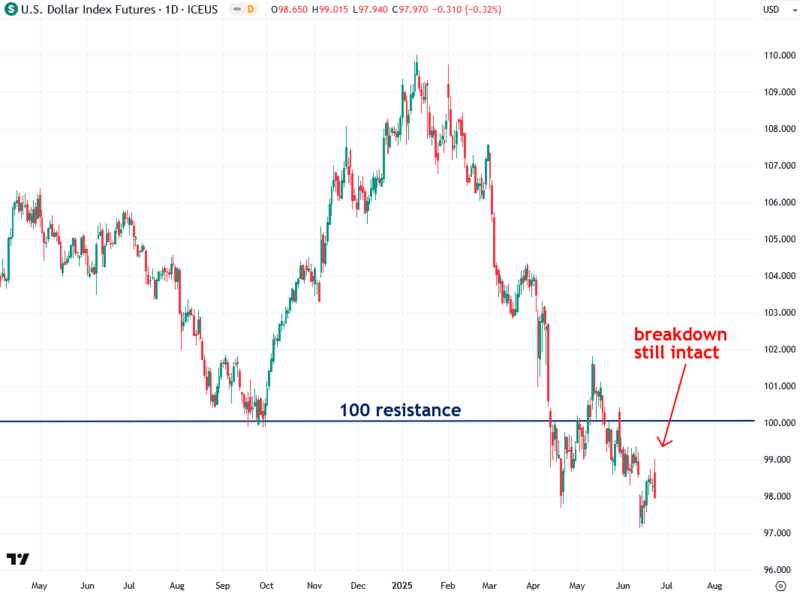
Another key asset I closely monitor to better understand the broader commodity landscape is the U.S. dollar—specifically the U.S. Dollar Index, which has historically moved inversely to commodities, including precious metals. As I’ve recently noted, the Dollar Index broke below the critical 100 support level, which has now flipped into resistance.
This marks a significant technical breakdown that tilts the outlook for the dollar decidedly bearish—while reinforcing a strong bullish backdrop for commodities like gold, silver, platinum, and copper. Notably, the dollar’s weakness amid recent Middle East turmoil—an environment that typically strengthens safe-haven assets like the dollar—signals deeper underlying fragility.
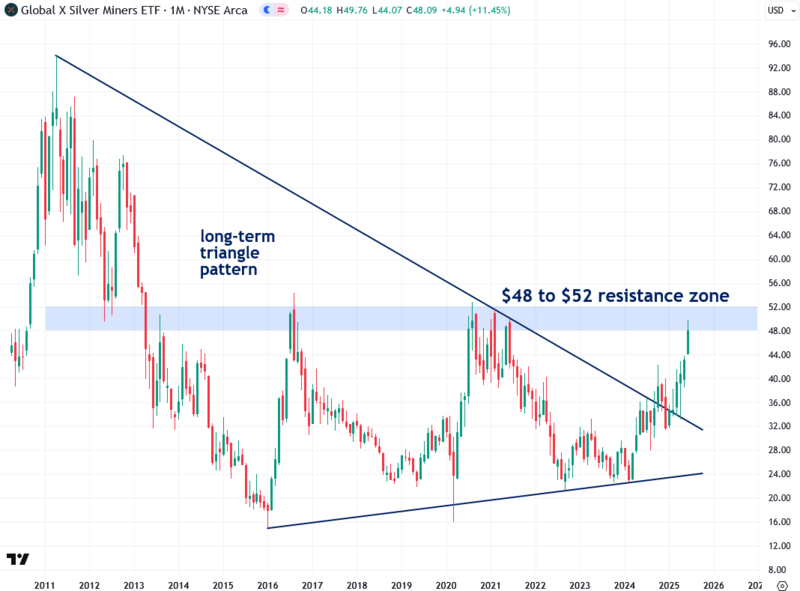
In addition to silver itself, I’m also highly bullish on silver mining stocks and ETFs, which I expect to deliver even larger gains in the coming bull market due to their leverage to the price of silver. Large silver miners, as tracked by the SIL ETF, have been performing strongly after breaking out of a long-term triangle pattern that dates all the way back to 2011.
SIL is now testing a critical resistance zone between $48 and $52—a level that has repeatedly capped rallies since 2016. I believe a decisive breakout above this zone, especially in tandem with a fully confirmed silver bull market, will trigger an explosive move higher in silver mining stocks. I’m watching closely and very excited about the potential upside.
To summarize, while silver has been relatively quiet in recent weeks following its encouraging breakout, that doesn’t mean the move has failed—nor is there reason for frustration or discouragement. I remain optimistic, especially recognizing that summer is often a period of consolidation due to lower trading volumes. That seems to be the case now with silver, gold, and copper all taking a breather.
I’m still watching for additional bullish confirmation, particularly a breakout in silver priced in euros, the Synthetic Silver Price Index, gold, and copper—as well as a continued breakdown in the U.S. dollar, which remains in a technically vulnerable position. I’ll continue to keep you updated as this situation evolves.
If you found this report valuable, click here to subscribe to The Bubble Bubble Report for more content like it.
Jesse Colombo is a financial analyst and investor writing on macro-economics and precious metals markets. Recognized by The Times of London, he has built a reputation for warning about economic bubbles and future financial crises. An advocate for free markets and sound money, Colombo was also named one of LinkedIn’s Top Voices in Economy & Finance. His Substack can be accessed here.

