")
(Jesse Colombo, Money Metals News Service) Gold, silver, and mining stocks just had a stellar day, significantly improving their technical setups. Gold jumped 2.8% while silver surged 5.38%, driven by a weaker U.S. dollar and escalating trade tensions with China.
Over the weekend, President Trump accused China of violating a recent trade agreement and announced that U.S. tariffs on steel and aluminum would increase this week. Let’s take a look at the charts.
First, let’s take a look at gold via COMEX futures, which I follow closely due to its tendency to trade in clean $100 increments—creating strong support and resistance around round numbers like $3,000, $3,100, $3,200, and so on.
Yesterday’s surge pushed gold to a close just below the $3,400 level, which is an encouraging sign. However, I’d prefer to see a decisive close above $3,400 to confirm that further gains are likely on the horizon.
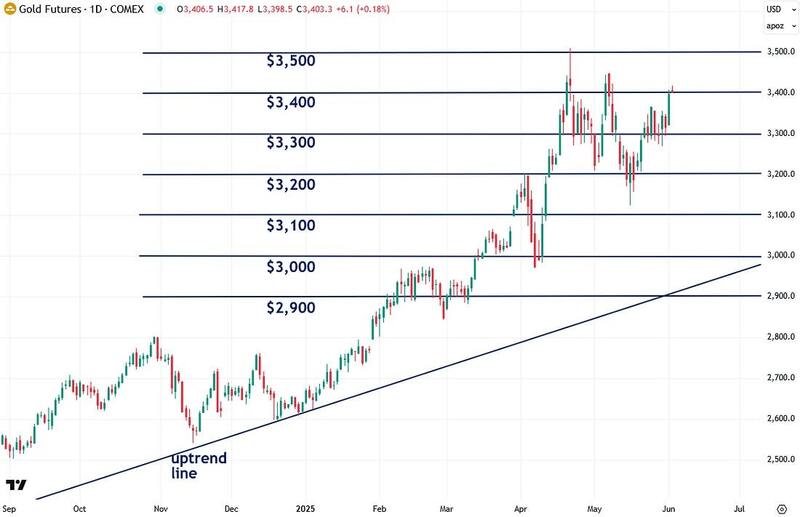
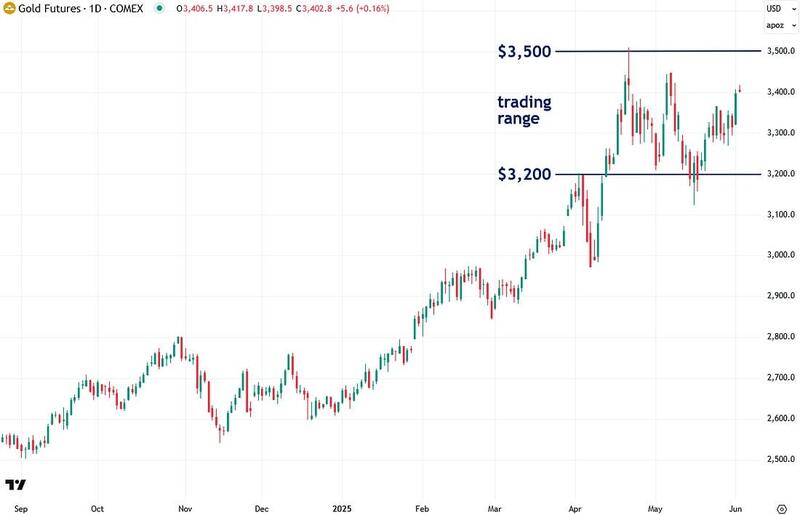
Gold remains in a healthy consolidation range between $3,200 and $3,500, pausing to catch its breath after strong gains earlier this spring. This sideways action may continue a bit longer, but a decisive breakout above $3,500 is the key signal I’m watching.
That would likely mark the start of gold’s next major leg higher—potentially targeting $4,000 next, given its significance as a major psychological milestone that tends to act like a magnet for price.
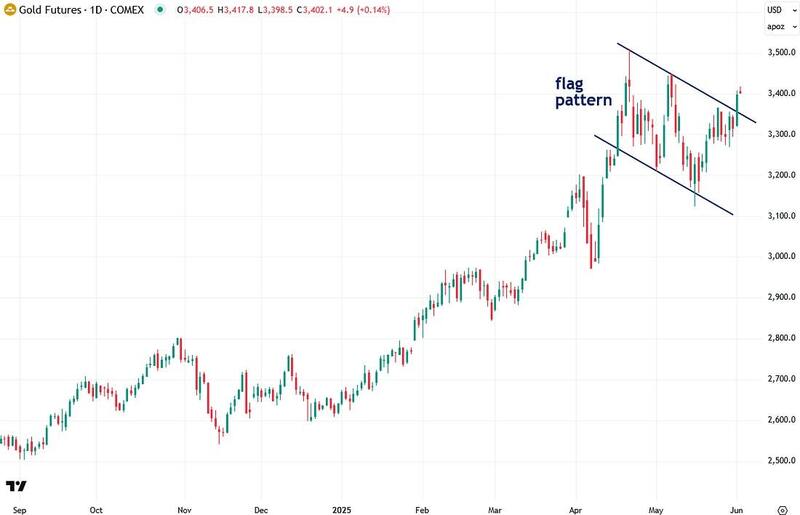
I also want to point out that gold had been forming a bull flag pattern over the past couple of months, and yesterday’s surge triggered a breakout—an encouraging development that deserves attention:
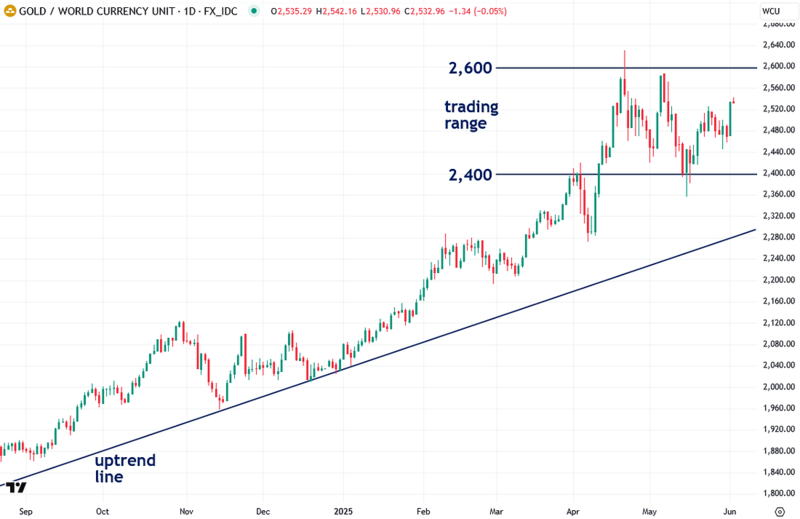
I’ve recently begun tracking gold priced in the World Currency Unit (WCU)—a composite currency based on the GDP-weighted average of the world’s 20 largest economies.
In many ways, it offers one of the most balanced and accurate reflections of gold’s true global performance, which is why I’ve been paying close attention to it.
Gold priced in World Currency Units (WCUs) clearly demonstrates that its uptrend remains strong, with a well-defined trading range between 2,400 and 2,600 that’s important to watch closely:
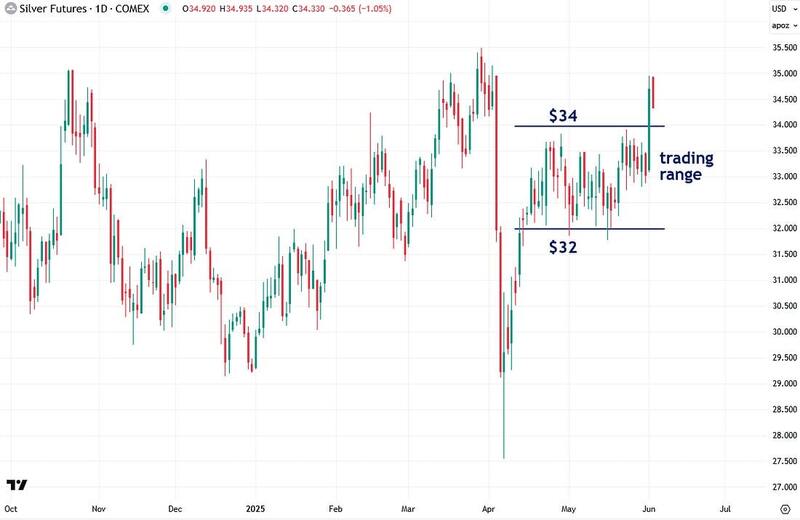
Now let’s turn to silver, which had an exceptional day. COMEX silver futures pushed cleanly through the critical $32–$33 resistance zone and continued into the $34–$35 zone, stopping just below the key $35 level.
A decisive breakout above $35 would likely mark the start of a powerful new silver bull market, as I outlined in a recent in-depth report. I’ll be watching this setup closely and keeping you updated—it’s shaping up very well.
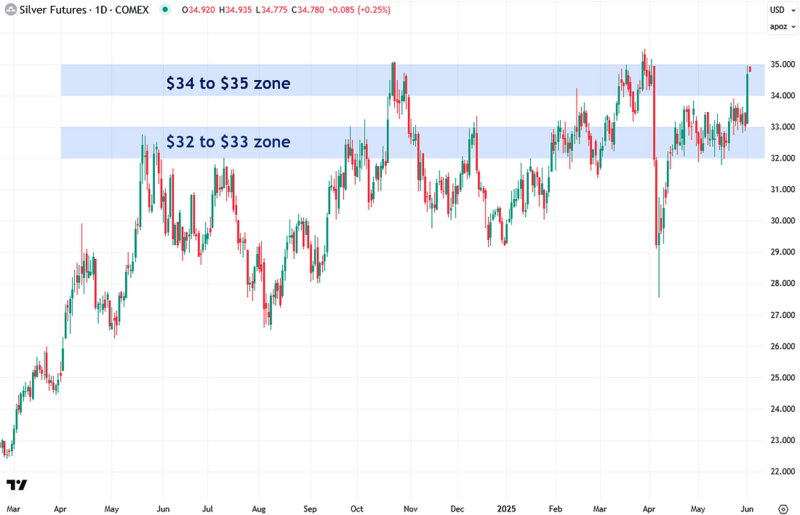
In recent updates, I’ve pointed out that silver had been trading in a range between $32 and $34. Yesterday’s surge broke it out of that range—a very encouraging sign for the bulls.
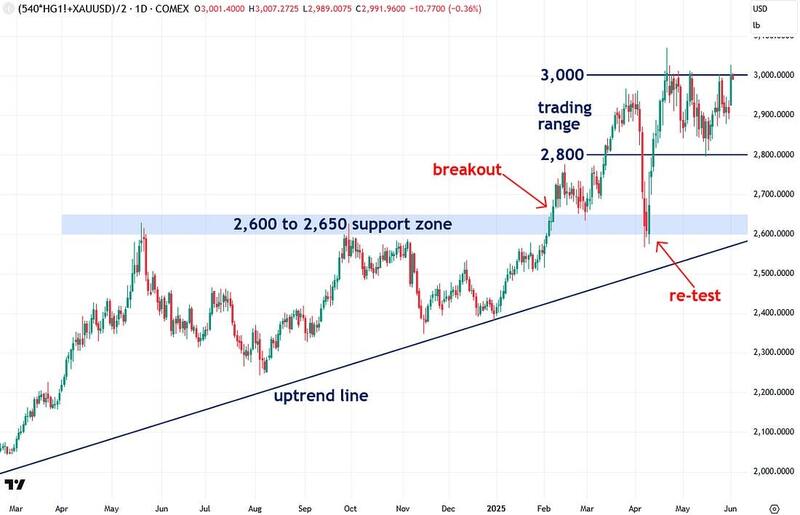
Next, let’s take a look at the Synthetic Silver Price Index (SSPI)—a proprietary indicator I developed to help validate silver’s price action and filter out potential false moves.
The SSPI is calculated as the average of gold and copper prices, with copper scaled by a factor of 540 to prevent gold from dominating the index. Interestingly, even though silver isn’t part of the calculation, the SSPI closely tracks its movements.
The SSPI remains in a consolidation range between 2,800 and 3,000. A breakout above the 3,000 level would be a strong bullish confirmation for silver.
Yesterday’s rally in both gold and copper pushed the SSPI right up to that 3,000 mark—an encouraging sign—but I’m waiting for a decisive close above it to confirm the breakout. I’ll be watching this development closely and will keep you all updated as it unfolds.
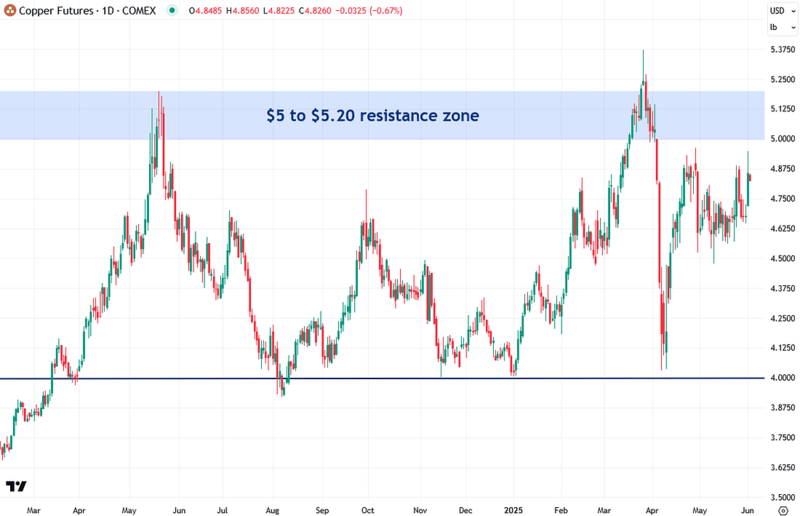
I also like to examine the underlying components of the SSPI to get a clearer sense of what’s happening beneath the surface. Since we’ve already covered gold, let’s now take a quick look at copper.
Copper is just under a major resistance zone between $5.00 and $5.20. A breakout above that zone would likely mark the start of a new copper bull market—one that would lift the SSPI and, by extension, silver as well. That’s because algorithmic trading systems arbitrage price relationships across metals, often causing their movements to align.
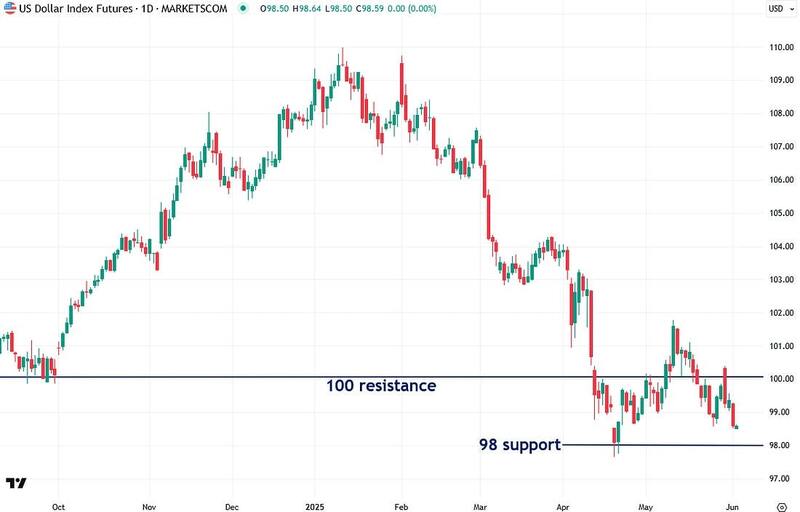
The latest round of tariff-related tensions with China triggered a drop in the U.S. dollar yesterday—a key driver behind the sharp moves in gold and silver, which, like most commodities, tend to trade inversely with the dollar. This weakness pushed the U.S. Dollar Index further below the critical 100 level.
I’ve recently shown it as a major threshold with important implications for precious metals. The next level I’m watching is the key support at 98. A decisive close below that would likely unleash a deeper wave of dollar weakness and should provide a powerful tailwind for gold and silver.
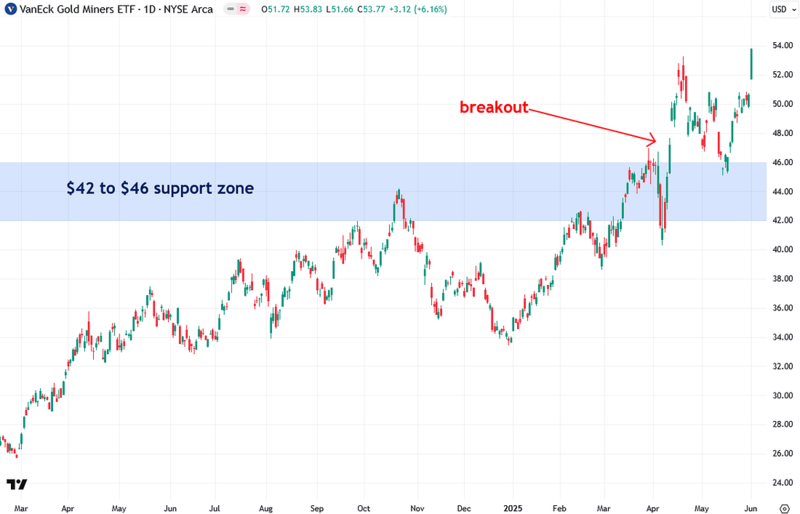
Next, let’s look at gold mining stocks, as tracked by the popular large-cap VanEck Gold Miners ETF (GDX). Notably, GDX recently broke above the $42–$46 resistance zone I’ve been highlighting—a strong signal that gold miners are finally coming to life.
Gold miners had a strong showing yesterday, with GDX surging 6.16%—another sign that we are likely on the verge of a major bull market in mining stocks.
After years of being deeply undervalued, they’re finally starting to attract attention and get bought up. I’m increasingly optimistic about the sector and will be writing more soon now that I have a much clearer read on their trajectory.
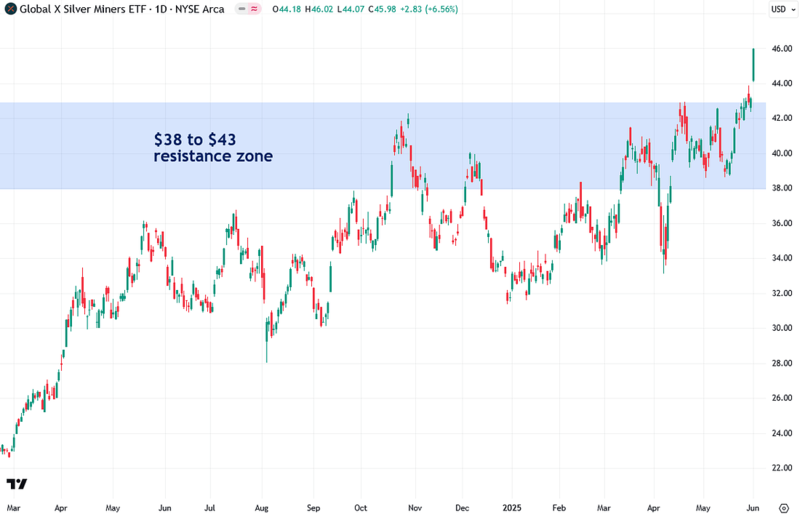
Silver miners, as tracked by the SIL ETF, had a strong day alongside silver itself—rallying 6.56% and finally breaking above the key $38–$43 resistance zone. This breakout indicates much more upside ahead, especially if silver can decisively clear the $35 level it has struggled with over the past year.
To summarize, the technical picture for gold, silver, and their miners has improved markedly following yesterday’s surge.
Silver, in particular, is finally showing real strength after a year of underperformance. I continue to watch for a decisive breakout above the key $35 resistance level, which I believe will trigger a powerful and sustained bull market.
Meanwhile, the U.S. dollar is showing additional signs of breaking down—driven in part by ongoing tariff-related tensions—which remains a major tailwind for precious metals. I’ll continue to keep you updated as this unfolds.
If you found this report valuable, click here to subscribe to The Bubble Bubble Report for more content like it.
Jesse Colombo is a financial analyst and investor writing on macro-economics and precious metals markets. Recognized by The Times of London, he has built a reputation for warning about economic bubbles and future financial crises. An advocate for free markets and sound money, Colombo was also named one of LinkedIn’s Top Voices in Economy & Finance. His Substack can be accessed here.