")
(Jesse Colombo, Money Metals News Service) U.S. Treasury market volatility is at three-decade lows, strongly indicating that a major move is ahead that will have significant effects on the financial markets, including precious metals.
Although often overlooked by retail investors, there is a strong case that the most important market to watch is not stocks but U.S. Treasuries.
Treasuries set the tone for long-term interest rates, shaping everything from government and corporate borrowing costs to mortgage rates, stock prices, and even precious metals prices, which perform best in environments of low real yields.
Right now, I see clear and compelling evidence that U.S. Treasuries are on the verge of a major move that will have sweeping consequences across the entire financial landscape.
My thesis is based on the fact that volatility in the U.S. Treasury market is currently at multi-decade lows, a condition known as a “volatility squeeze.” History shows that such squeezes in financial assets almost always precede major moves.
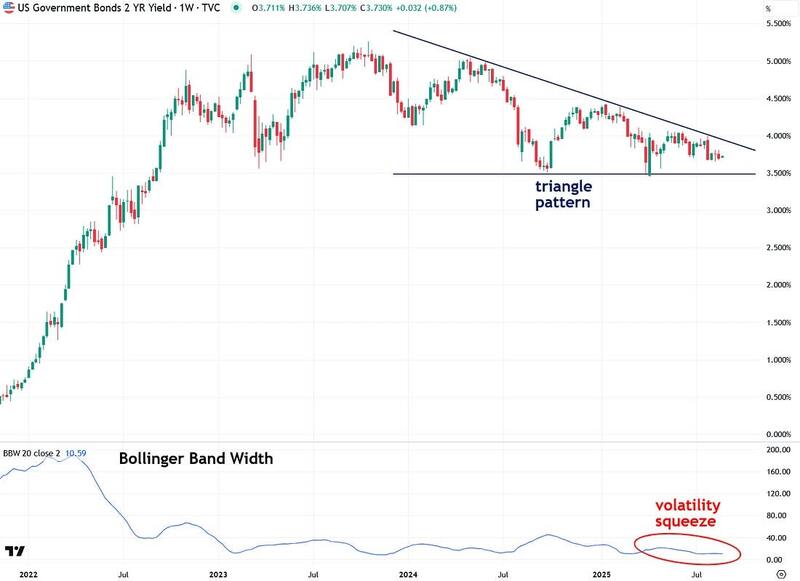
Now, let’s examine the charts across the Treasury complex, beginning with U.S. 2-Year Treasury Note yields, to highlight the highly unusual setup currently developing.
The weekly chart shows a triangle pattern forming over the past two years, signaling a period of compression similar to a spring under pressure. When that pressure is released, it typically leads to a powerful breakout, and I expect a similar move in Treasury notes soon.
This volatility squeeze is further confirmed by the Bollinger Band Width indicator beneath the chart, which is a valuable tool for tracking volatility in financial markets and assets.
I’ll address which direction Treasuries are likely to break out shortly, but first, I want to show the fascinating volatility squeeze setup across the entire Treasury complex.
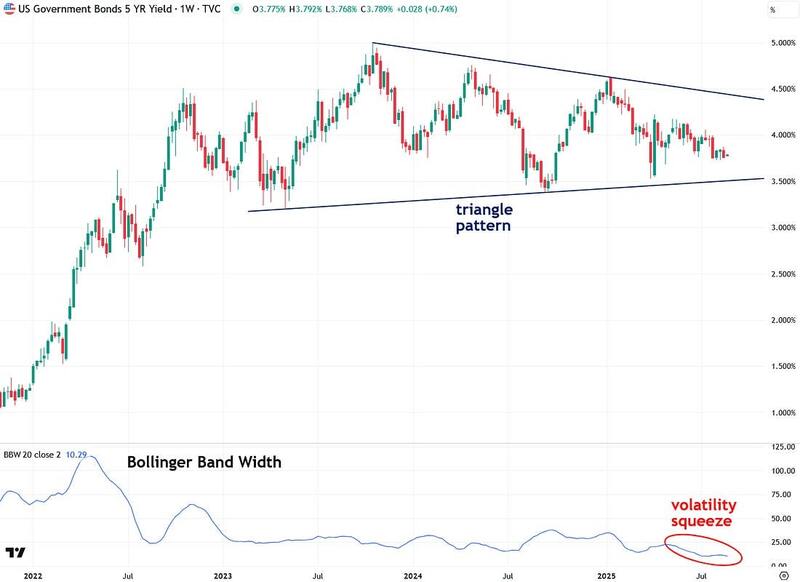
The same triangle pattern and volatility squeeze setup can also be seen in U.S. 5-Year Treasury Note yields:
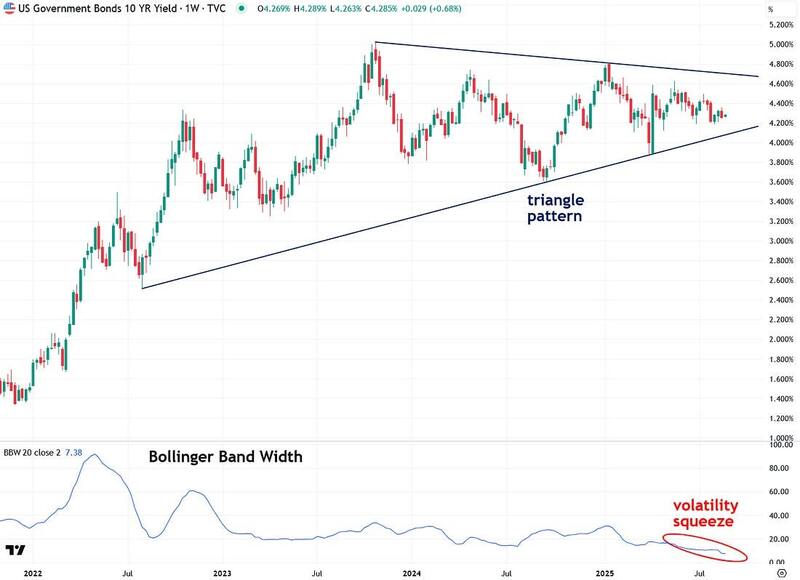
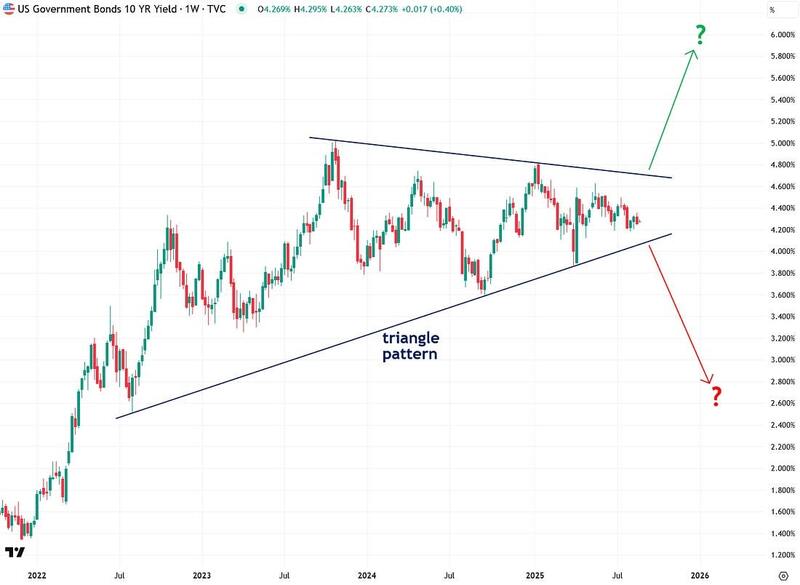
The most important and closely watched bellwether of the Treasury complex, the 10-Year Note yield, is also showing a triangle pattern and volatility squeeze setup:
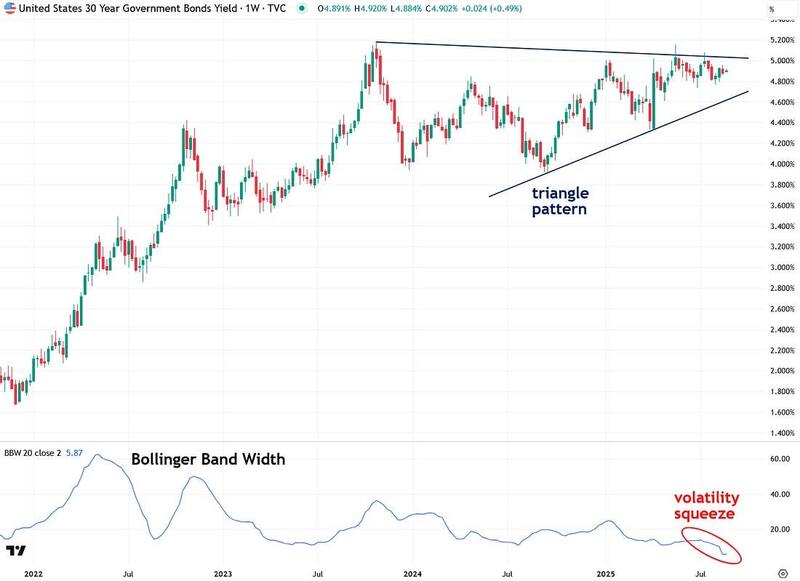
Finally, the 30-Year U.S. Treasury Bond yield is showing the same setup as the shorter maturities, and the fact that this pattern is consistent across the entire Treasury complex strengthens my thesis by highlighting how broad-based it is:
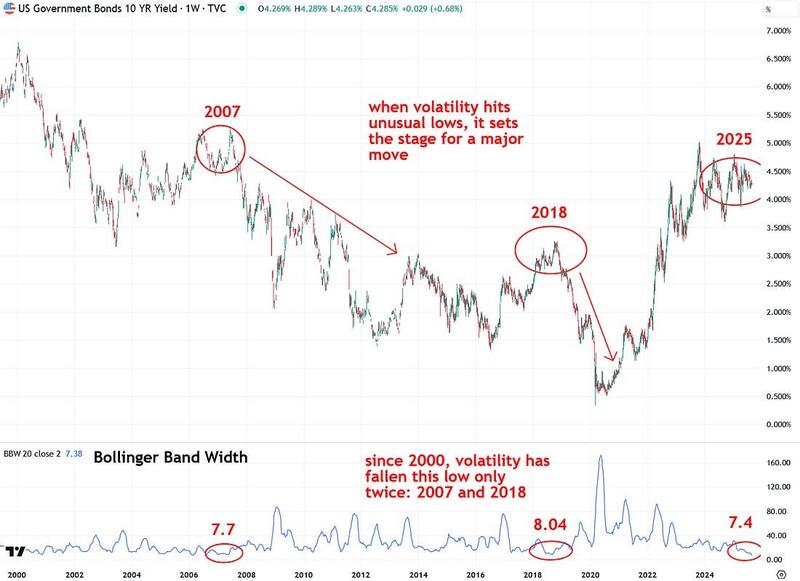
To illustrate just how extreme the current volatility squeeze in U.S. Treasuries is, I created a weekly chart of U.S. 10-Year Note yields going back to the year 2000.
According to the Bollinger Band Width indicator, volatility is now at its lowest level in this entire period at 7.4. The only other times it came close were in 2007 (7.7) and 2018 (8.04), and both of those periods were followed by major moves in interest rates.
I believe another significant move is approaching very soon.
It is important to note, however, that while the last two episodes resulted in falling yields, a volatility squeeze does not indicate direction. It only signals that a large move is ahead.
I will address the likely direction shortly, but for now, focus on the highly unusual nature of this volatility setup.
Now that I’ve made the case that the unusually calm behavior in U.S. Treasuries is likely to give way to an explosive move, I want to address the question of direction.
Unfortunately, the outlook is uncertain because of conflicting economic crosscurrents, primarily inflation and economic growth.
The situation is unclear, and even the Fed, Wall Street, and most economists are acknowledging that reality. This uncertainty is the precise reason why Treasuries remain stuck in a low-volatility holding pattern as they wait for further clarity.
Once that clarity emerges, Treasuries are going to pick a direction and move significantly.
As mentioned earlier, Treasury yields are driven primarily by inflation and economic growth. High inflation and strong growth push yields higher, while low inflation and weak growth cause yields to fall.
Like all bonds, Treasuries are sensitive to inflation because it erodes the value of their fixed coupon payments.
Treasuries are also sensitive to economic growth since strong growth often leads to higher inflation and tighter monetary policy from the Federal Reserve.
In contrast, weak growth and especially recessions typically cause Treasury yields to decline because they signal falling inflation and looser monetary policy. This is often accompanied by quantitative easing (QE), where the Fed digitally creates money to buy Treasuries, which drives yields down further.
While the straightforward scenarios above are easy to understand, the real world is often more complicated.
Things become tricky when Treasuries receive mixed signals from the economy, particularly in a stagflationary environment where inflation remains stubbornly high but economic growth is weak. In such situations, the proper response for Treasuries is far less clear.
That is exactly where we are right now, and it explains the current volatility squeeze in Treasuries as the market waits for additional inflation and economic data before committing to a clear direction.
Over the past month, concerns about a potential U.S. stagflationary scenario have been growing. A surprisingly weak July jobs report showed that only 73,000 jobs were added, while job growth for May and June was sharply revised downward by a combined 258,000 jobs.
This prompted Fed Chair Jerome Powell to acknowledge on Friday that “downside risks to employment are rising.”
On the inflation front, the Fed’s preferred gauge, the Personal Consumption Expenditures (PCE) price index, showed that core inflation rose to 2.8% in June, remaining well above the Fed’s 2% target and signaling that inflation is still stubbornly high.
Economists are increasingly concerned that the Trump administration’s new tariffs may already be contributing to higher prices and are watching upcoming inflation reports closely to see if this trend persists.
The key upcoming labor and inflation reports to watch are: Personal Consumption Expenditures (PCE) on August 29, the Producer Price Index (PPI) on September 10, and the Consumer Price Index (CPI) on September 11.
On the labor side, important releases include JOLTs Job Openings on September 3, the ADP Employment Report on September 4, Nonfarm Payrolls on September 5, and the weekly Initial Jobless Claims, released every Thursday morning.
My view, at least for now, is that a U.S. economic slowdown leading to a recession will become much more evident in the months ahead, and that will drive Treasury yields sharply lower.
I see the abrupt deceleration in both the job market and the housing market as early evidence. Adding weight to this outlook, Moody’s Analytics chief economist Mark Zandi recently issued a high-profile recession call, citing a weakening labor market along with soft consumer spending, construction, and manufacturing data.
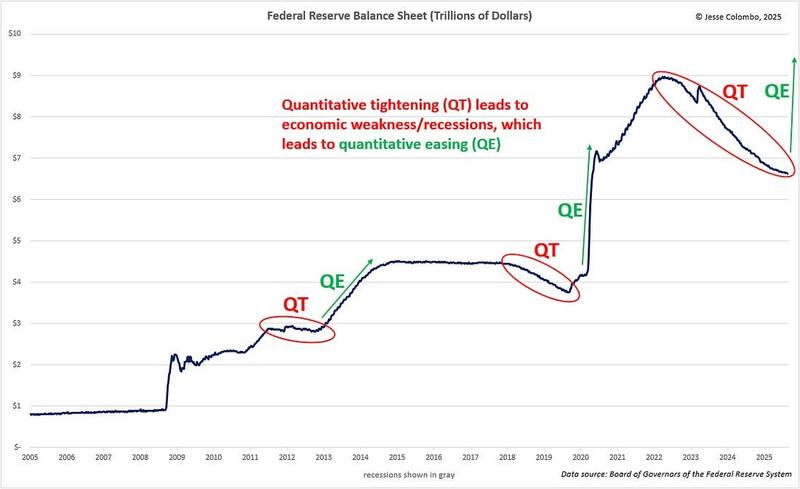
What raises the risk of an economic slowdown and recession is the Fed’s ongoing quantitative tightening (QT) program, which is shrinking its balance sheet by reducing holdings of Treasuries and mortgage securities, as shown in the chart below.
The flip side, however, is that a resulting recession would likely trigger a return to quantitative easing (QE) or digital money creation.
Since the U.S. economy is now heavily dependent on monetary stimulus, this would almost certainly lead to another round of Treasury purchases by the Fed, driving yields much lower. Such a shift would also be extremely bullish for precious metals.
While the Treasury market remains in a holding pattern, waiting for upcoming data to confirm or refute either a recessionary or stagflationary scenario, I want to emphasize the value of technical analysis in this scenario.
As an analyst, I do not make short-term predictions; instead, I prefer a reactive approach that allows the market to reveal its direction through decisive price action supported by volume.
At this point, I am waiting for Treasury yields to break out clearly in one direction, confirmed by economic data consistent with that move. My bias is that Treasury yields are more likely to decline from here due to economic weakness, but I am maintaining a disciplined wait-and-see approach.
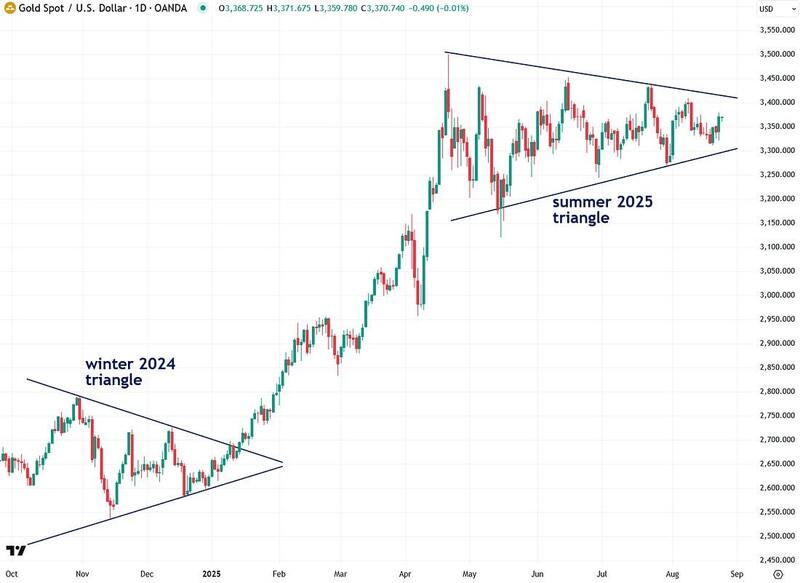
The current volatility squeeze in Treasuries closely parallels the five-month volatility squeeze and triangle pattern forming in gold. In fact, the indecision in Treasuries is a major driver of that behavior in gold, since gold takes its cues heavily from U.S. interest rates.
If interest rates were to fall significantly from here, that would likely trigger a breakout in gold from its triangle pattern, with the potential to run to at least $4,000.
To summarize, volatility in U.S. Treasuries is at its lowest level in decades, and history shows that such periods almost always precede major moves. This dynamic, known as a volatility squeeze, indicates that a powerful move in Treasuries is coming that will have a dramatic impact across the financial markets.
For now, the Treasury market is in a holding pattern as it waits for clearer signals from upcoming economic data. Neither the Treasury market nor most economists can yet say with confidence which path lies ahead, but that clarity should emerge soon, and when it does, it should trigger a historic move in interest rates.
If the outcome is a sharp economic slowdown or recession, Treasury yields will fall significantly, and that would propel gold to $4,000+ and silver to $60+.
If you found this report valuable, click here to subscribe to The Bubble Bubble Report for more content like it.
Jesse Colombo is a financial analyst and investor writing on macro-economics and precious metals markets. Recognized by The Times of London, he has built a reputation for warning about economic bubbles and future financial crises. An advocate for free markets and sound money, Colombo was also named one of LinkedIn’s Top Voices in Economy & Finance. His Substack can be accessed here.