")
(Jesse Colombo, Money Metals News Service) As a silver investor and analyst, I closely track copper because of its strong correlation with—and influence on—silver. Silver is unique in that it’s both a precious metal and an industrial one, with industrial demand making up about 55% of total usage. This gives silver price behavior that often mirrors copper, a purely industrial metal.
Additionally, there are trading algorithms that arbitrage the silver-copper relationship, reinforcing their tight price connection.
In this article, I’ll break down where copper stands now and what it is signaling for silver.
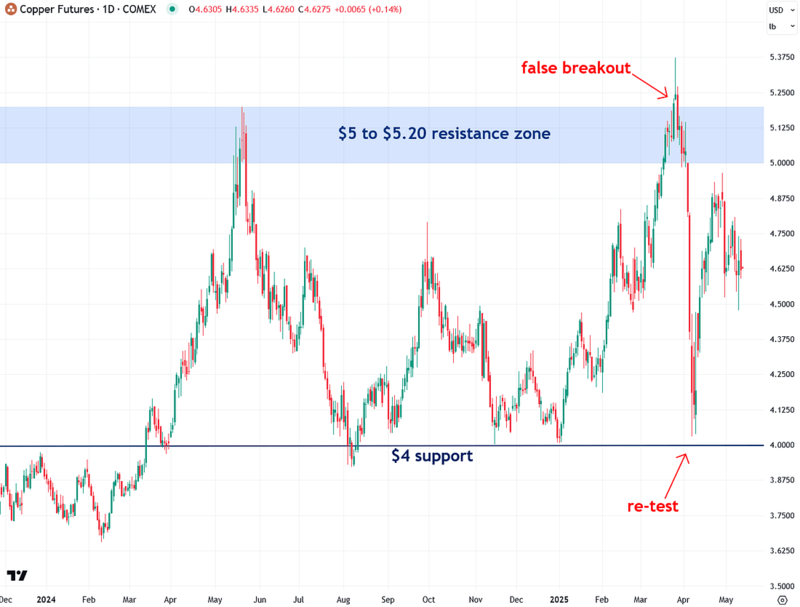
Let’s start with copper’s daily price chart. For much of the past year, I’ve highlighted the key $4-per-pound support level as a major line in the sand.
Each time copper has tested that level, it’s presented a high-probability bounce opportunity—which has played out multiple times, including at the very start of this year. In that instance, copper rebounded sharply and surged 34% to a high of $5.37 by late March, driven by a rush to bring copper onshore ahead of potential tariffs on imported supplies.
In late March, copper attempted to break above the $5 to $5.20 resistance zone—a key ceiling that has held since 2021—but the breakout ultimately failed.
Copper soon fell back below that level and was hit hard along with most other markets starting on April 2nd, known as “Liberation Day,” when President Trump unveiled his new tariff plan.
This serves as a valuable reminder of why flexibility and responsiveness to market signals are essential. When a breakout or breakdown fails and the price reverses, the reason doesn’t matter—that shift alone is a signal worth respecting.
False breakouts and breakdowns are common, especially in volatile environments like this one, where new policies are being introduced rapidly and often unpredictably.
Markets tend to react unpredictably under Trump’s leadership style, which is rooted in surprise and negotiation—traits consistent with his “art of the deal” philosophy—making trading much more challenging when he is at the helm.
Interestingly, after the “Liberation Day” shock and broad market selloff, copper retested the critical $4 support level before bouncing sharply and reclaiming much of its losses—a confusing round-trip move that left many investors and traders scratching their heads (myself included).
Over the past couple of weeks, copper has been consolidating around the $4.70 level, with no clear directional signal for now.
That said, I believe there’s a strong chance copper will soon make another run at the $5 to $5.20 resistance zone—this time with a higher likelihood of breaking through and launching a more sustained bull market, as I’ll explore further in this article.
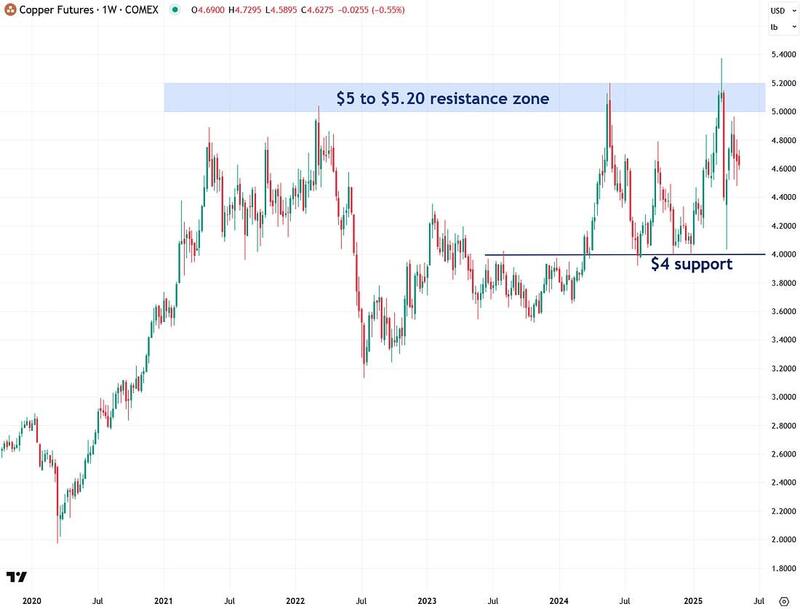
A look at the longer-term weekly chart highlights the significance of the $4 support level below and the $5 to $5.20 resistance zone above, with copper currently trading in the middle of that range.
For now, it remains in a holding pattern, offering no clear directional signal either way.
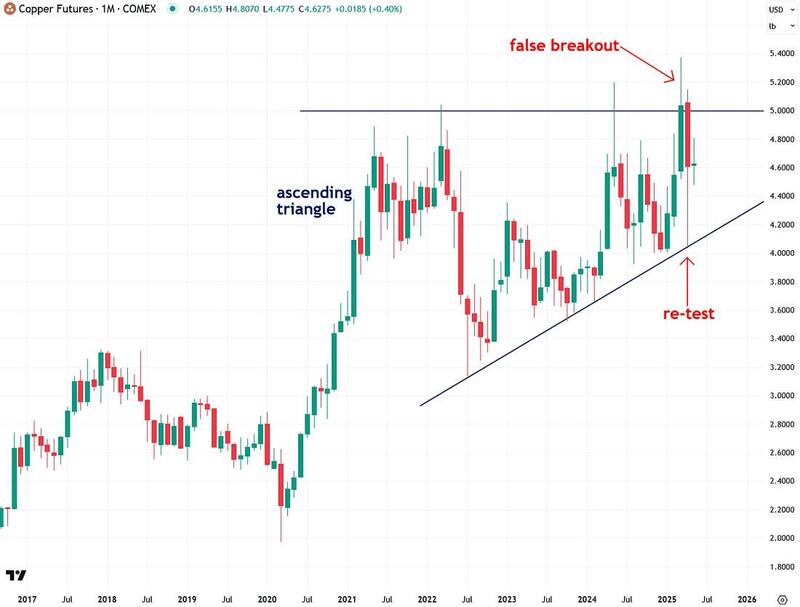
The even longer-term monthly chart reveals that copper’s consolidation since 2021 is forming an ascending triangle pattern—a classic bullish setup. This indicates that a major bull market will likely begin once copper finally breaks above the key $5 to $5.20 resistance zone.
If confirmed, I believe this move will mirror the strength of the 2020 rally that preceded it. Using the measured move principle in technical analysis, the breakout projects a potential $3 per pound advance—taking copper to $8, which represents a 73% gain from current levels.
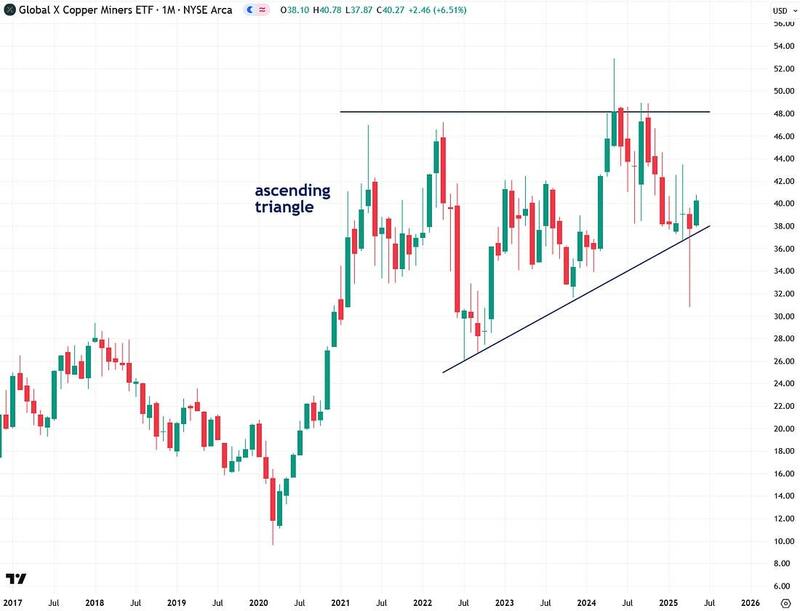
I’m also seeing a similar ascending triangle pattern forming in copper mining stocks, as indicated by the Global X Copper Miners ETF (COPX).
I believe that once both copper and COPX break out of their respective patterns, it will spark a powerful bull run in copper stocks—one I’m eager to participate in, as it aligns with my broader bullish outlook on commodities, which I’ll delve into shortly.
It’s also worth noting that copper and silver mining stocks are closely correlated, since silver is often produced as a byproduct of copper mining. That overlap means a bull market in copper miners would likely coincide with a strong rally in silver miners as well.
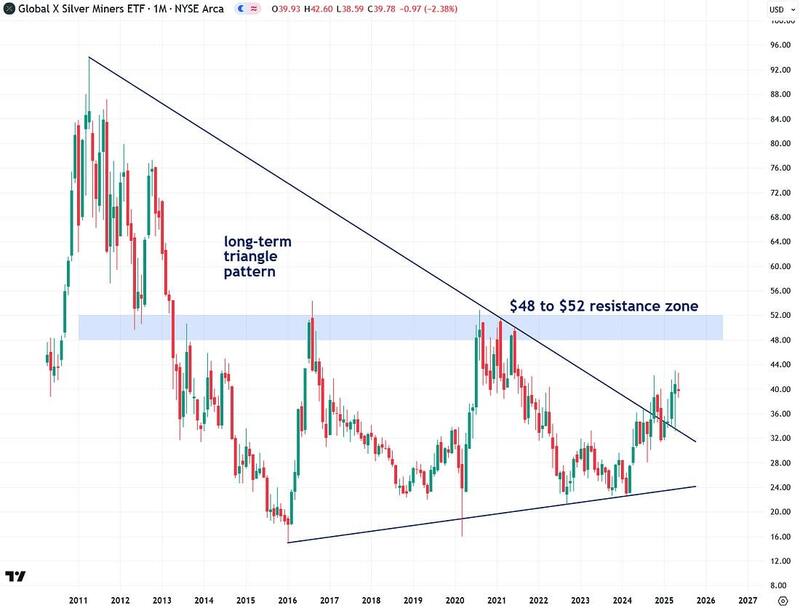
I’m also anticipating a strong bull market in silver mining stocks and am closely watching the Global X Silver Miners ETF (SIL) for signals.
A few months ago, SIL broke out of a long-term triangle pattern dating back to 2011, and a decisive close above the $48 to $52 resistance zone would provide further confirmation that the bull market is underway.
I believe this move will coincide with a breakout in the COPX copper miners ETF as well. Silver mining stocks, in my view, represent one of the most compelling and potentially profitable opportunities in the next leg of the commodities bull market.
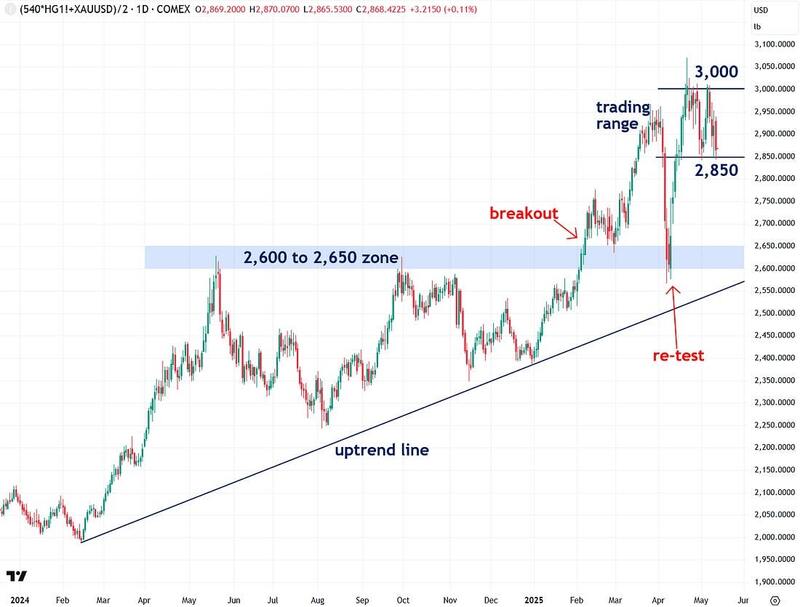
Moving on, I often track and share a custom indicator I developed—the Synthetic Silver Price Index (SSPI)—to help validate and analyze silver’s price trends with greater clarity.
The SSPI averages the prices of gold and copper, with copper weighted by a factor of 540 to ensure gold doesn’t dominate the calculation. Interestingly, despite silver not being an input, the SSPI has shown a remarkably strong correlation with silver’s price—making it a valuable tool for cross-verifying trends and potential breakouts.
For much of the past year, the 2,600 to 2,650 zone has served as a key resistance level for the SSPI. I’ve maintained that a breakout above this range would signal a bullish shift for both the SSPI and silver.
Although the “Liberation Day” market shock triggered a sharp drop, the SSPI found solid support right at this critical zone and has since rebounded strongly. It’s now trading in a range between 2,850 and 3,000. A breakout from this range—ideally to the upside—would offer another meaningful signal for silver’s direction.
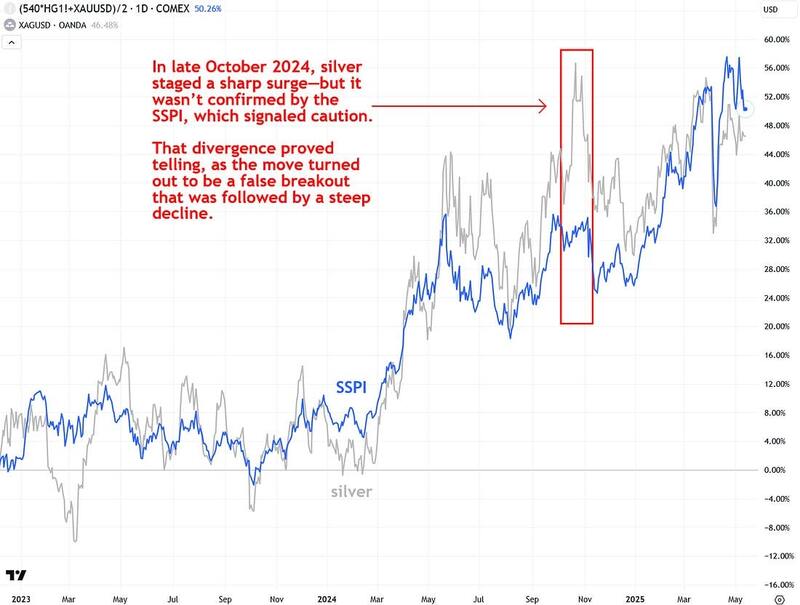
I’ve often pointed out that the Synthetic Silver Price Index (SSPI) and the price of silver are highly correlated—with a five-year correlation coefficient of 0.842 on a scale from -1 to 1.
Now I want to show you the chart so you can see that close relationship for yourself.
What’s especially remarkable is that the SSPI is calculated solely from the average prices of gold and copper—silver itself isn’t even included—yet the correlation remains incredibly strong. This underscores silver’s unique nature as both a precious metal and an industrial metal.
I use the SSPI as a tool to confirm—or question—moves in silver. When silver diverges significantly from the SSPI, it often signals that something unusual is going on with silver.
For instance, if the SSPI is surging while silver remains flat, that indicates likely price suppression in silver. Conversely, if silver appears to be breaking out but the SSPI doesn’t reflect a similar move, it increases the likelihood of a false breakout in silver—and that’s precisely what happened in late October 2024.
In both scenarios, the SSPI serves as a valuable reality check for silver’s price action. Ideally, I want to see both moving in tandem to confirm the validity of a trend, and at the moment, they are trading largely in sync.
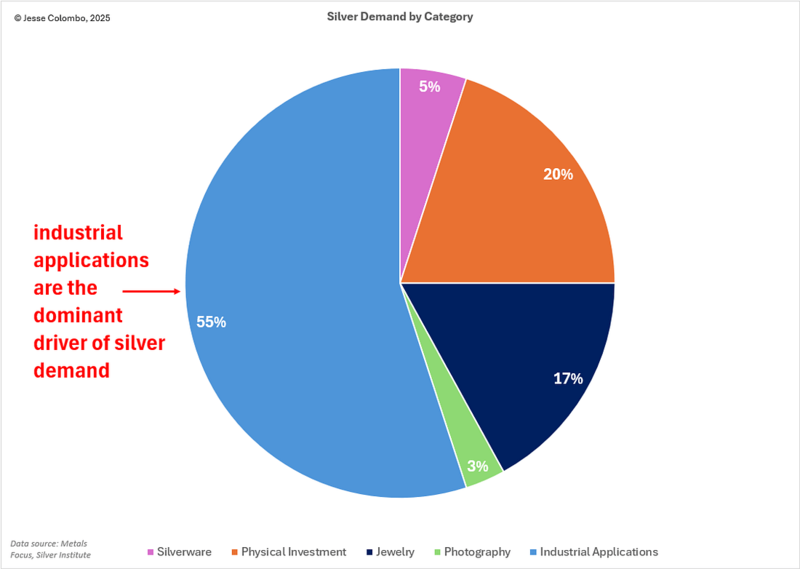
Throughout this article, I’ve emphasized that silver is a hybrid metal—part industrial, part precious—with its industrial demand significantly outweighing its investment demand.
Because of this, silver’s price is highly sensitive to the ups and downs of the economy, often causing it to behave more like a risk asset than the traditional safe-haven role people typically expect.
As the pie chart below shows, the majority of silver demand—about 55%—comes from industrial use, while only around 20% comes from investment.
In contrast, gold demand is driven largely by investment (44.57%) and jewelry (48.74%), with much of that jewelry serving as a form of investment as well, particularly in developing countries like India and China.
As I mentioned earlier, I’m a long-term bull on copper and expect a powerful bull market in the years ahead for both technical and fundamental reasons. From a technical analysis perspective, the ascending triangle pattern I highlighted earlier points to a strong bull market.
Fundamentally, the outlook is equally compelling—copper plays a vital role in clean energy technologies, from electric vehicles to renewable power infrastructure. Goldman Sachs even referred to copper as “the new oil” because of its central importance in the energy transition.
Supporting this view, Visual Capitalist—well known for its economic infographics—recently published a striking infographic titled “Could Copper Be the Next Oil?”
In 2023, the IMF projected a 66% increase in copper demand from 2020 to 2040 as the global shift away from oil gains momentum. The infographic highlights how copper demand is expected to rise significantly in the coming decades, while oil consumption is predicted to decline.
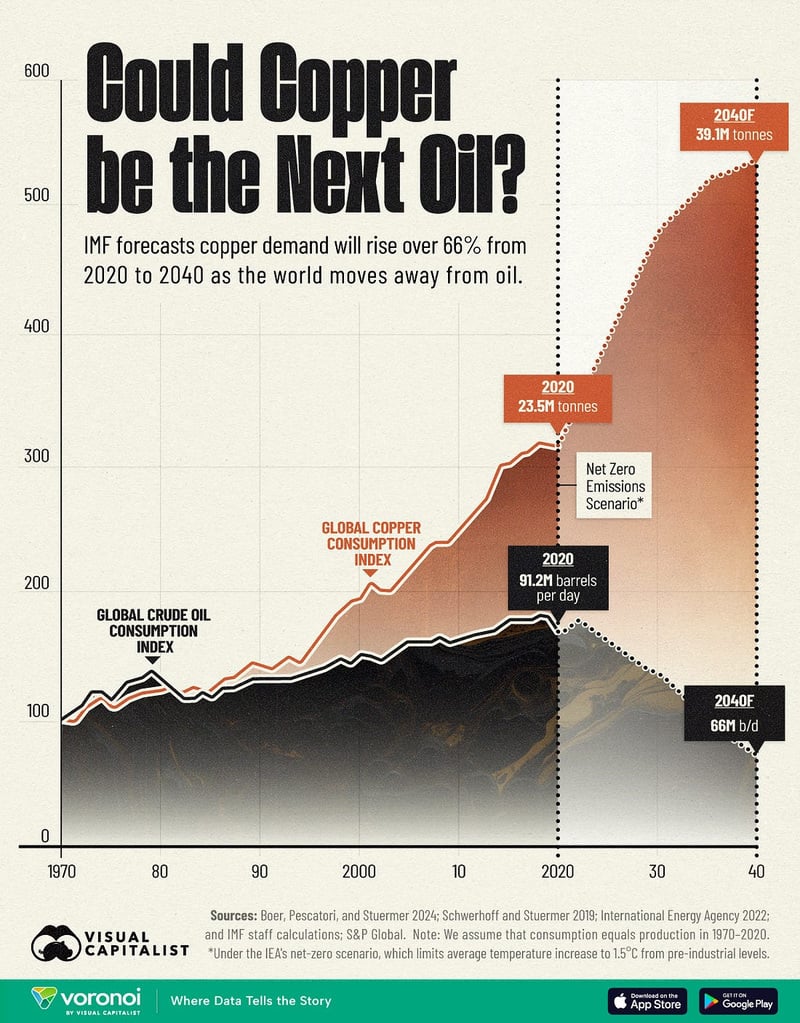
Copper plays a vital role in numerous applications, including the electrical grid, electric vehicles (EVs), and renewable energy technologies. In addition to its importance in clean energy, copper is widely used in sectors such as construction, infrastructure, and defense, thanks to its exceptional properties. Under a net-zero emissions scenario aimed at limiting global temperature increases to 1.5°C above pre-industrial levels, global copper demand is expected to rise significantly, from 25.9 million tonnes in 2023 to 39.1 million tonnes by 2040.
A significant portion of this growth is anticipated to come from the electric vehicle industry, where copper is a critical component. Battery electric vehicles, on average, contain 60-83 kilograms of copper—four times the amount used in internal combustion engine vehicles, which typically require only 15-20 kilograms of copper per car.
In contrast, oil consumption is projected to decline significantly, falling from 101.9 million barrels per day in 2023 to 66 million barrels per day by 2040. This decrease is fueled by global efforts to cut carbon emissions, the rapid adoption of renewable energy, and advancements in energy efficiency. Stricter policy regulations are also playing a key role in reducing oil demand.
Last year, French billionaire and commodities trader Pierre Andurand predicted that copper prices could soar to $40,000 per tonne in the coming years—a more than fourfold increase from the current price of $9,485 per tonne.
“We are moving towards a doubling of demand growth for copper due to the electrification of the world, including electric vehicles, solar panels, wind farms, but also military usage and data centres,” he told the Financial Times.
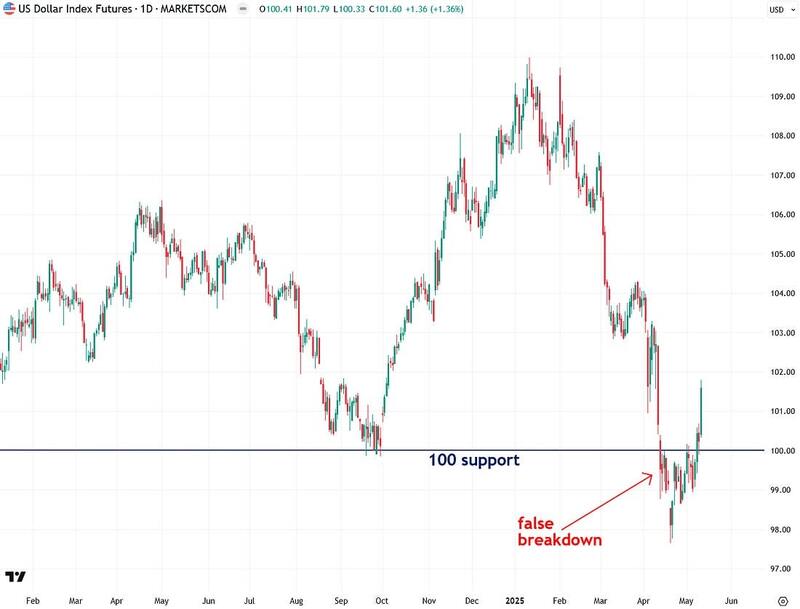
Next, let’s look at the U.S. Dollar Index—a measure of the dollar’s exchange rate against a basket of major world currencies (not its domestic purchasing power)—because it has a strong influence on commodity prices, including copper, silver, and gold.
The dollar and commodities typically trade inversely, meaning that a stronger dollar tends to weigh on commodity prices, while a weaker dollar generally supports them.
In recent weeks, I’ve been highlighting how the U.S. Dollar Index broke below the key 100 support level—a level that had held for the past couple of years—and I’ve been watching closely to see if that breakdown would hold and lead to further downside.
Interestingly, it turned out to be a false breakdown, as the index has since climbed back above the 100 mark in recent days, buoyed by optimism around new trade deals—particularly with China—under the Trump administration.
While I maintain a longer-term bearish outlook on the dollar, as I’ll explain shortly, I always respect price action and avoid fighting the market. For now, momentum is to the upside in the dollar, which, all else being equal, creates a headwind for commodities—though they’ve been holding up surprisingly well so far.
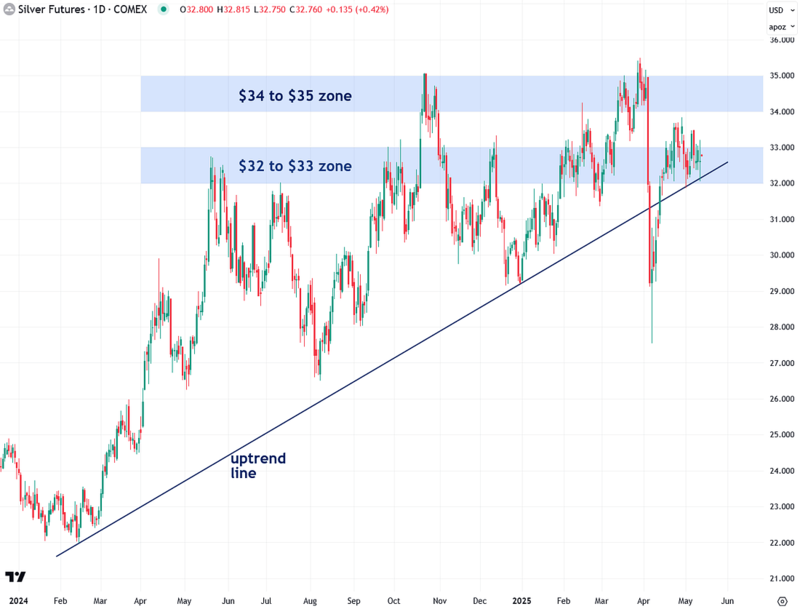
Now, after all this discussion of assets correlated with silver, let’s take a look at silver itself.
As the chart below shows, COMEX silver futures have remained steady in recent weeks, consolidating in the $32 to $33 range while holding above a key uptrend line—a positive sign.
To confirm that the next leg of silver’s bull market is underway, I’d like to see a decisive breakout above both the $32–$33 resistance zone and the $34–$35 resistance zone. For now, it’s a waiting game.
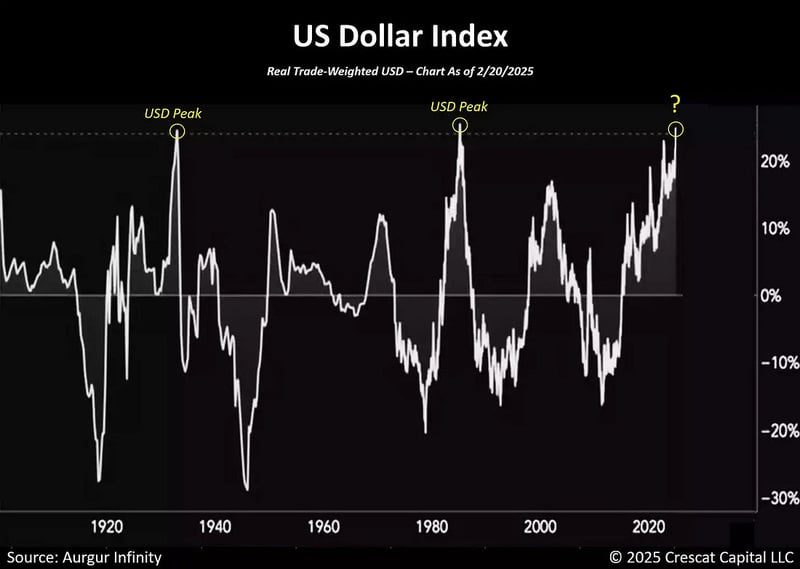
Although the U.S. Dollar Index is experiencing a short-term bounce, I don’t believe the move has much staying power. I remain firmly bearish on the dollar over the long term relative to other major currencies.
One key reason is that, based on over 120 years of historical data, the dollar is now more overvalued than at nearly any other point—except 1933 and 1985, both of which were followed by substantial declines.
I believe that when the dollar eventually corrects and mean reverts, it will ignite a powerful bullish surge across the commodities sector—including copper, gold, silver, and mining stocks.
There are strong parallels between today’s setup and the early 2000s, when an overvalued dollar during the dot-com bubble entered a prolonged bear market. That decline helped launch a commodities supercycle that lasted until around 2012. I see a similar pattern unfolding again this time around.
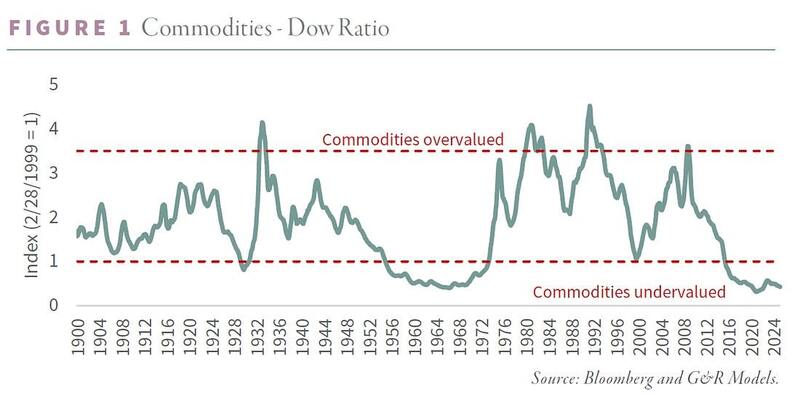
Further confirmation that a new commodities supercycle is ahead comes from the commodities-to-Dow ratio, which shows commodities are deeply undervalued relative to stocks—at levels historically seen before major commodity bull markets and prolonged periods of stock market stagnation.
This indicates an impending capital rotation, with investment shifting away from equities and into hard assets and natural resources.
To summarize, I closely monitor copper as an indicator for silver, given their strong correlation. In the short term, both metals are consolidating and catching their breath after a dramatic, tariff-driven plunge and rebound over the past month.
However, the longer-term outlook remains bullish, supported by copper’s ascending triangle formation that indicates significantly higher prices ahead, along with strong fundamentals tied to the metal’s vital role in clean energy technologies.
As an investor, I’m enthusiastic about the opportunities in both silver and copper mining stocks and intend to capitalize on that potential. For now, though, I’m watching to see how both metals break out from their current consolidation patterns.
If you found this report valuable, click here to subscribe to The Bubble Bubble Report for more content like it.
Jesse Colombo is a financial analyst and investor writing on macro-economics and precious metals markets. Recognized by The Times of London, he has built a reputation for warning about economic bubbles and future financial crises. An advocate for free markets and sound money, Colombo was also named one of LinkedIn’s Top Voices in Economy & Finance. His Substack can be accessed here.