
(Jesse Colombo, Money Metals News Service) I’ve been spotting and writing a lot about volatility squeezes lately, which occur when volatility drops to extremely low levels and signal big upcoming moves. This dynamic is currently developing in assets such as gold and U.S. Treasuries.
These volatility squeezes are not coincidences, as they are actually all related. Much of the financial markets are in a gigantic volatility squeeze as they wait for a major catalyst.
These potential catalysts include further clarity on the U.S. stagflation situation (inflation + economic stagnation), the likelihood of further rate cuts, and the next Fed chair that President Trump will appoint.
In today’s update, I want to focus on the volatility squeeze developing in copper and how it is setting up both copper and its closely correlated counterpart, silver, for a significant move.
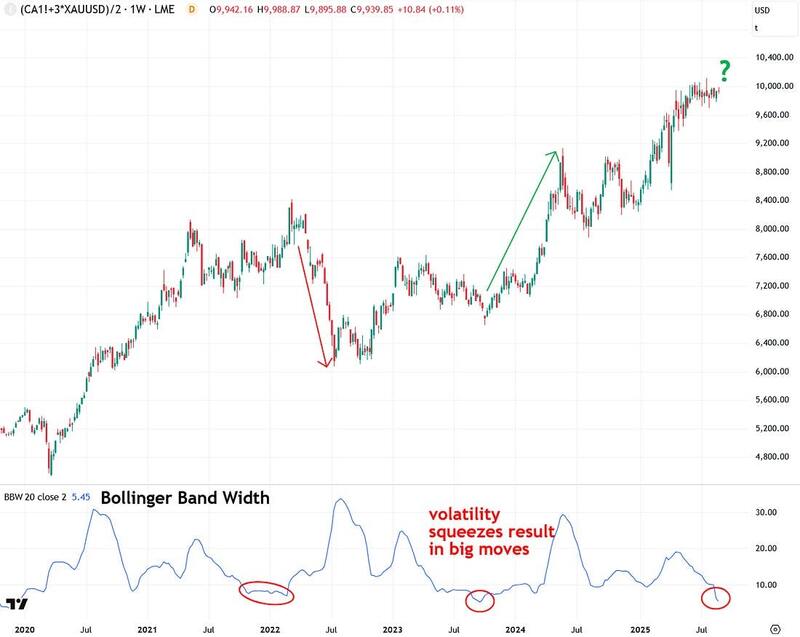
Let’s first take a look at the weekly chart of London Metal Exchange (LME) copper futures, which I am now using as my preferred proxy for copper prices instead of U.S. COMEX copper futures because the latter have been heavily distorted by the Trump administration’s recent tariffs.
This chart shows a clear volatility squeeze as indicated by the Bollinger Band Width indicator beneath the chart, which is a valuable tool for tracking volatility in financial markets and assets.
The last time volatility in copper dropped to such extremely low levels was in 2022 and 2023, and in both instances, it led to significant moves in copper prices.
Based on the current setup, I believe another major move in copper is ahead as this volatility squeeze resolves.
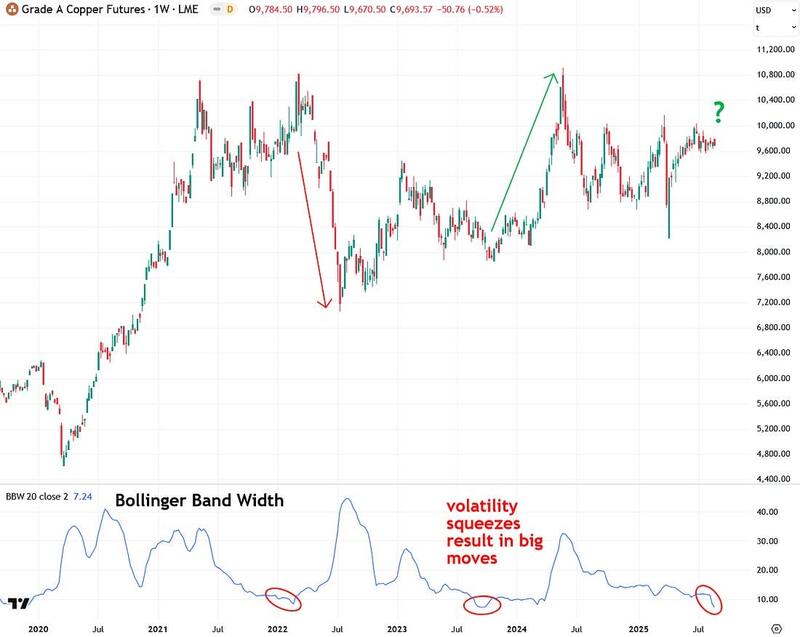
While volatility squeeze setups indicate that a big move is likely ahead, they do not reveal the direction of that move. To determine the likely outcome, we need to incorporate other methods, including chart analysis.
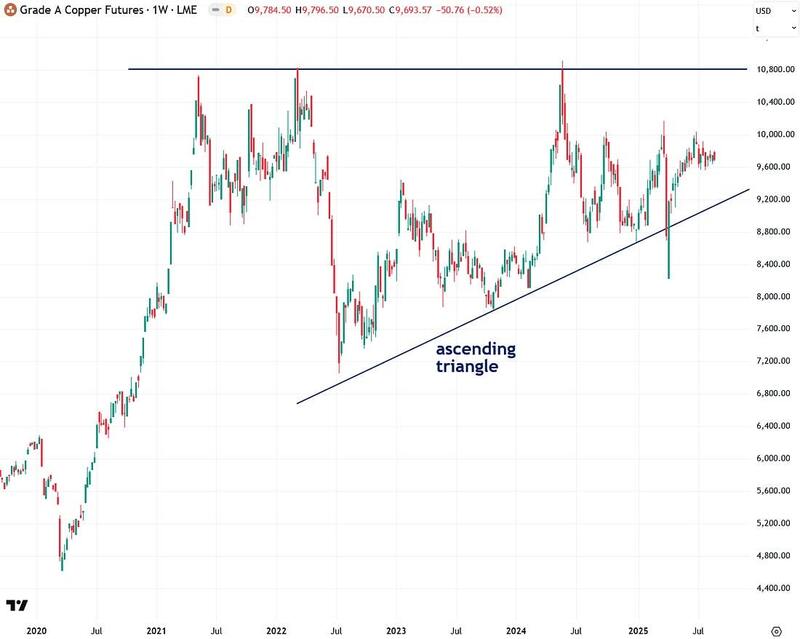
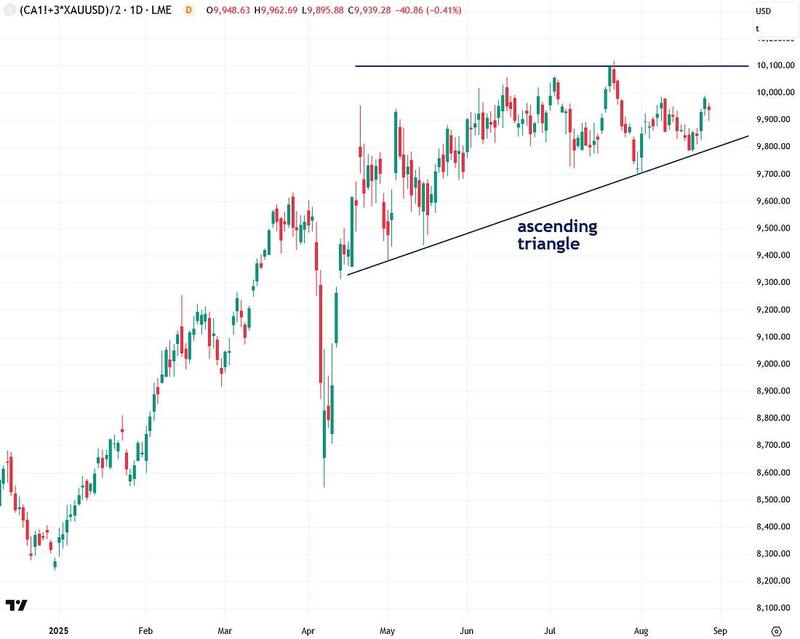
The weekly chart of LME copper futures currently shows an ascending triangle pattern forming, which is typically a bullish chart pattern. However, it must be confirmed by a decisive breakout on strong volume above the $10,800 per tonne resistance level.
This combination of an ascending triangle and a volatility squeeze indicates that a significant bullish move in copper is likely ahead.
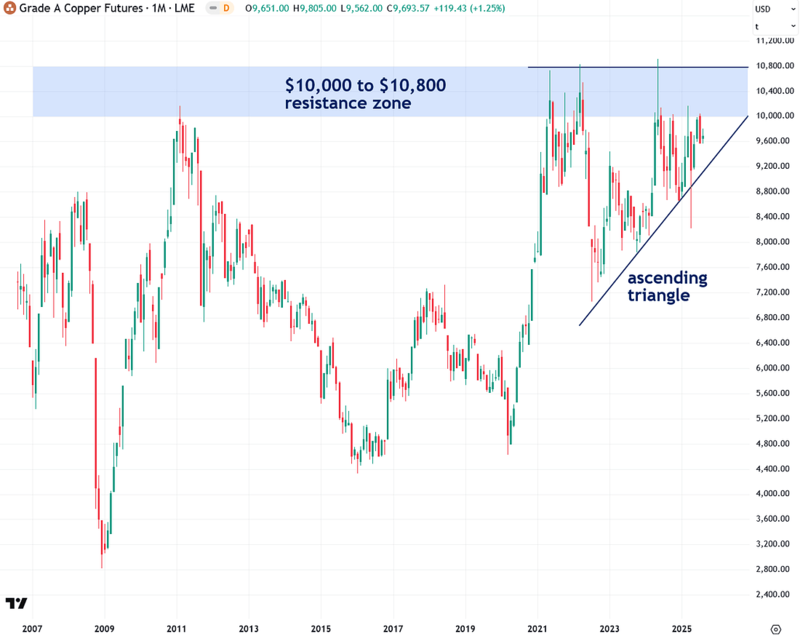
The longer-term monthly chart of LME copper futures highlights both the ascending triangle pattern that has been developing over the past several years and the critical $10,000 to $10,800 per tonne resistance zone, which dates all the way back to 2011.
Once copper achieves a decisive breakout from both its ascending triangle and above this major resistance zone, I believe a powerful new bull market in copper will begin.
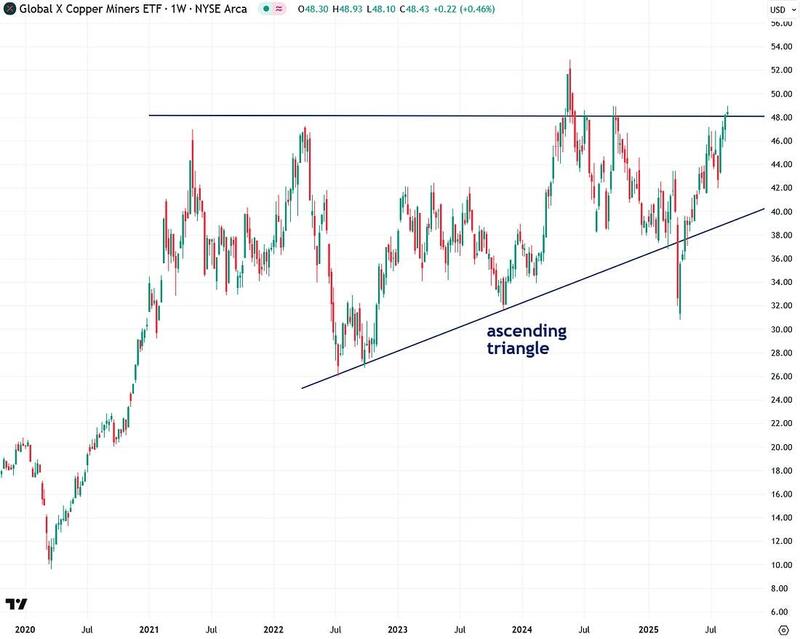
For those interested in this bullish copper thesis, one convenient way to gain exposure is through the Global X Copper Miners ETF (COPX).
Interestingly, COPX has also been forming an ascending triangle pattern since 2021 and is now on the verge of breaking out. However, I would prefer to see a decisive close above the $48 resistance level for stronger confirmation of the breakout.
In addition to the bullish technical setup in copper, the fundamental picture is also highly supportive. For example, Goldman Sachs has dubbed copper “the new oil” due to its essential role in clean energy technologies, and Visual Capitalist published a fascinating infographic on this theme.
Copper earns this title because its demand is expected to surge in the coming decades, while oil consumption is projected to decline as the world transitions away from fossil fuels. Reflecting this shift, the IMF forecasts a 66% increase in copper demand between 2020 and 2040.
Copper’s likely upcoming bull market would align with the outlook of French billionaire and commodities trader Pierre Andurand, who predicted that copper prices could soar to $40,000 per tonne in the coming years—a more than fourfold increase from the current price of $9,682 per tonne.
Explaining his bullish stance, Andurand stated, “We are moving towards a doubling of demand growth for copper due to the electrification of the world, including electric vehicles, solar panels, wind farms, as well as military usage and data centers.”
If copper enters a major bull market, it would also be highly bullish for silver because silver, along with gold, is heavily influenced by the prices of both metals. This relationship exists largely due to arbitrage trading algorithms that tend to pull silver in the same direction as gold and copper.
Because of this little-known dynamic, I developed a proprietary indicator called the Synthetic Silver Price Index (SSPI).
The SSPI is essentially the average of gold and copper prices, and it has proven to track silver extremely closely, making it a powerful tool for both confirming and predicting moves in silver, as I’ll demonstrate shortly.
Interestingly, a volatility squeeze is also forming in the SSPI, which reflects the volatility squeezes occurring in its underlying components, gold and copper.
As shown in the chart below, previous volatility squeezes in the SSPI have consistently led to significant moves in the indicator—and, by extension, in silver as well. I view the current volatility squeeze in the SSPI as a strong signal that a major move in silver is approaching.
Zooming in on the daily chart of the Synthetic Silver Price Index (SSPI) shows that an ascending triangle pattern is forming (there are a lot of these lately!).
Once this pattern breaks out, it is likely to result in a significant bullish move, which would also place substantial upward pressure on silver.
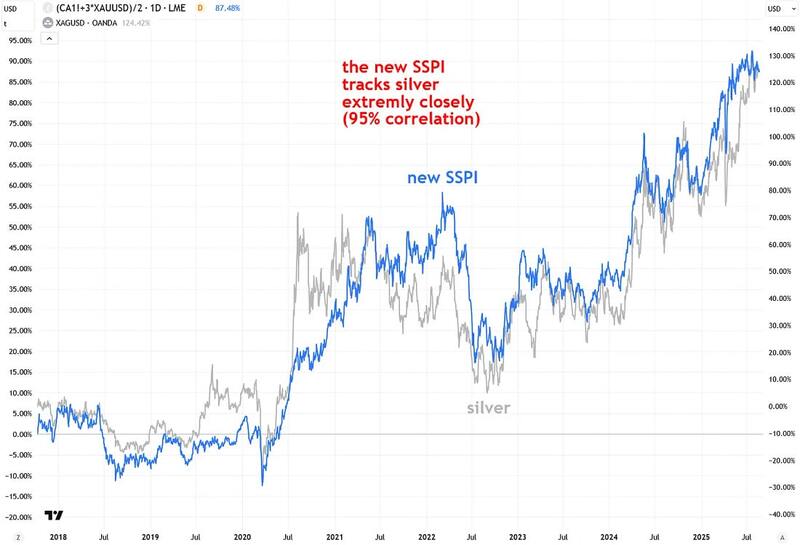
The chart below illustrates just how closely correlated my proprietary Synthetic Silver Price Index (SSPI) and silver are. Since 2018, the correlation has been an impressive 95%, which is remarkable given that silver is not even a component of the SSPI.
One of my favorite ways to use the SSPI is to perform technical analysis on it and treat its breakouts and breakdowns as signals for what silver is likely to do next. This approach has proven to be highly effective and, in many cases, the SSPI even leads the price of silver.
For this reason, the current volatility squeeze and ascending triangle pattern forming in the SSPI are particularly noteworthy and well worth watching for silver bulls.
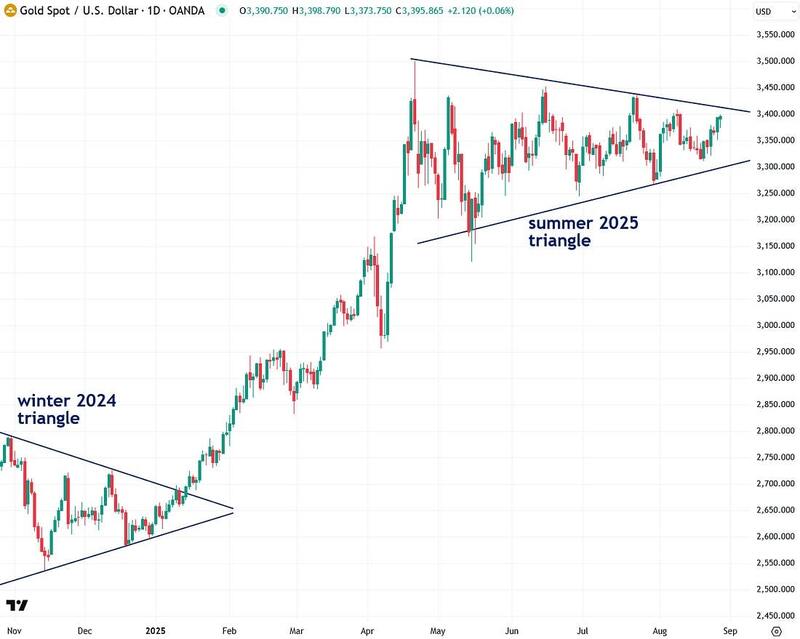
I mentioned earlier that the volatility squeeze in the Synthetic Silver Price Index (SSPI) is the byproduct of the volatility squeezes in its two components, copper and gold. I’ve already shown the setup in copper, so now let’s look at the triangle pattern that has been forming in gold over the past five months.
I am now waiting for a decisive breakout in gold. Assuming that occurs, I expect it to run to $4,000 and beyond, which would, in turn, boost both the SSPI and silver itself.
With all this discussion about how bullish moves in copper and gold would be highly supportive for silver, let’s finally take a closer look at silver itself.
I believe silver began a major new bull market in early June when it broke above the $32 to $35 resistance zone that had capped its progress for much of the previous year.
Since that breakout, silver has been consolidating and forming a triangle pattern of its own. Despite this sideways action, I believe the bull market thesis remains intact. Silver has simply been taking a healthy breather, which is normal during the summer months when much of Wall Street is on vacation.
Looking ahead, the combination of summer ending and the potential for major breakouts in both copper and gold is what I believe will propel silver’s bull market much higher—to $50, $60, and far beyond. However, confirmation is still needed, which would come in the form of silver closing above the key $40 resistance level.
To summarize, the extremely quiet trading that has characterized Summer 2025 has actually created multiple volatility squeezes across key assets, including U.S. Treasuries, gold, and copper.
Ironically, periods of extremely low volatility almost always resolve with extremely high volatility, and I believe we are likely to see that happen in these assets soon.
While many investors are bored with these assets, and most don’t even understand what volatility squeezes are, they should be doing the exact opposite.
This is shaping up to be a very exciting setup and opportunity for precious metals investors, as big rallies are likely to erupt this fall.
If you found this report valuable, click here to subscribe to The Bubble Bubble Report for more content like it.
Jesse Colombo is a financial analyst and investor writing on macro-economics and precious metals markets. Recognized by The Times of London, he has built a reputation for warning about economic bubbles and future financial crises. An advocate for free markets and sound money, Colombo was also named one of LinkedIn’s Top Voices in Economy & Finance. His Substack can be accessed here.