
(Mike Maharrey, Money Metals News Service) Gold demand followed prices higher and set a new record in 2024.
According to data compiled by the World Gold Council, total gold demand rose by 1 percent to 4,974 tonnes, driven by robust central bank buying and surging investor interest in the East.
Gold recorded high prices 40 times during the year and edged out U.S. stocks to rank first among traditional asset classes. Gold also performed better than U.S. bonds, dollars, commodities, and global treasuries.
The average gold price in Q4 was a record $2,663. For the entire year, gold averaged $2,386, a 23 percent increase over 2023.
The combination of record prices and record demand volumes drove demand in value terms to its highest-ever level – $382 billion.
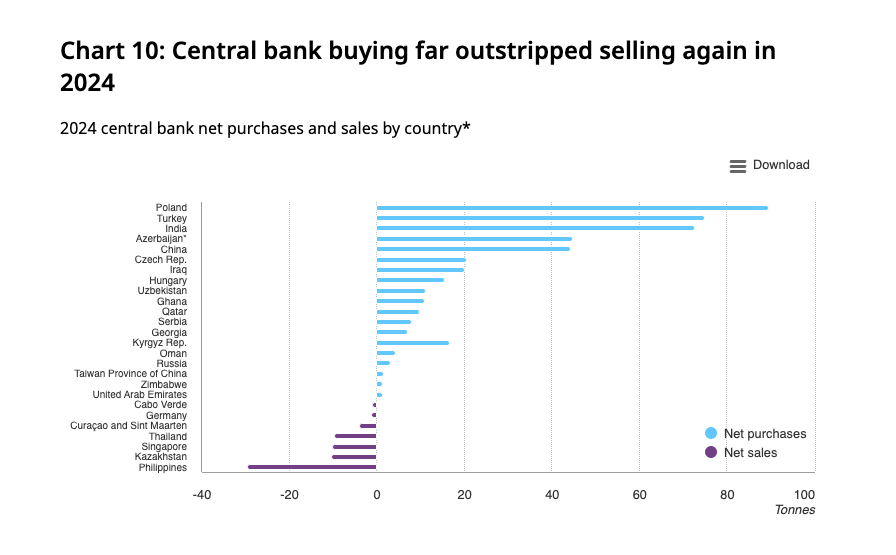
Central Bank Buying
As the World Gold Council put it, central banks seem to have an “insatiable appetite” for gold.
Central banks added more than 1,000 tonnes to their holdings for the third straight year. At 1,044.6 tonnes, central bank purchases came in just slightly below the 2023 total of 1,050.8 tons.
To put the last three years into perspective, the annual average central bank gold purchases between 2010 and 2021 were only 473 tonnes.
Last year marked the 15th straight year of net central bank gold buying.
Poland led the way, adding 90 tonnes to its reserves. Earlier this year, National Bank of Poland Governor Adam Glapiński indicated the central bank plans to increase its gold holdings to 20 percent of its reserves.
“This makes Poland a more credible country, we have a better standing in all ratings, we are a very serious partner, and we will continue to buy gold.”
Investment Demand
Global gold investment hit a 4-year high in 2024, coming in at 1,179.5 tons. That represented a 25 percent annual increase.
Bar and coin demand was unchanged at 1,186 tonnes. However, the value of physical gold investment surged 23 percent to a record $91 billion.
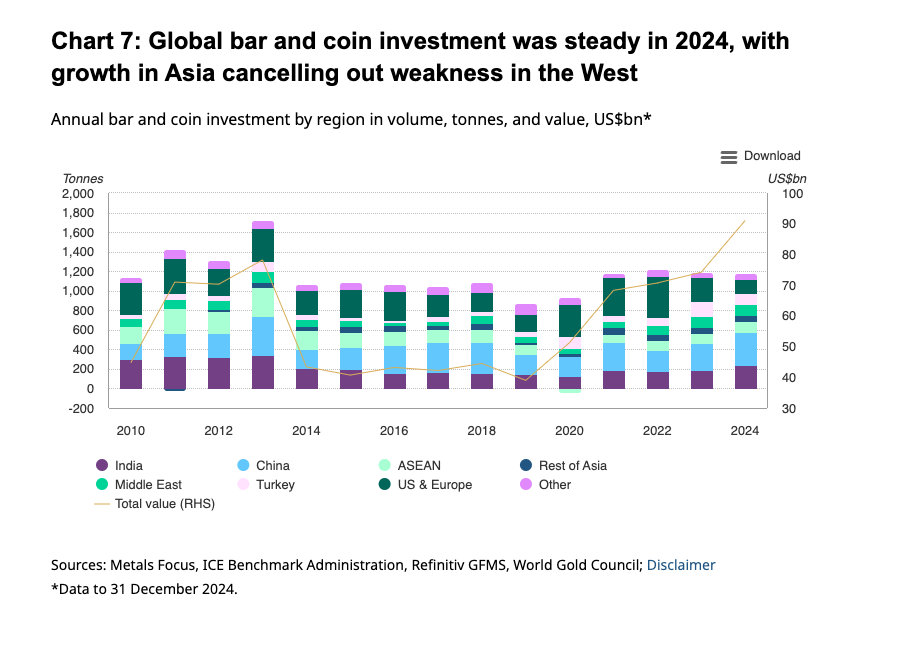
There was a shift in buying, with coin sales falling by 31 percent as bar sales grew by 10 percent. This reflects the source of physical demand, which was primarily in the East. Asian investors tend to favor gold bars.
Bar and coin demand in India grew by 29 percent. Indian demand got a big boost from a cut in the excise tax that went into effect in July.
Chinese physical gold demand hit its highest total in a decade, rising by 20 percent.
Meanwhile, in the U.S., bar and coin demand fell by 33 percent and hit the lowest level since 2020.
Retail gold demand hit a 17-year low in Europe, halving from an already low base in 2023.
The flow of physical gold from West to East was particularly pronounced in the early months of the gold bull run.
ETF investing rebounded in the second half of 2024, with funds reporting net gold inflows in the third and fourth quarters.
For the year, funds globally reported a modest net 7-tonne outflow of gold.
After sinking to a four-year low of 3,080 tonnes in April, global ETF gold holdings recovered throughout the remainder of 2024, ending the year very close to where they had started (3,219t vs 3,226t).
Jewelry Demand
Jewelry demand fell by 11 percent to 1,877 tonnes. High prices created significant headwinds in the jewelry market.
However, those high prices also drove the total value of jewelry demand up by 9 percent last year to $144 billion.
Except for 2020, at the height of the pandemic, jewelry demand was at the lowest level since the Great Recession in 2009.
China drove this demand weakness with a 24 percent drop. For the second time in three years, China ceded its position to India as the largest jewelry market.
Indian gold jewelry demand was also down, although much more modestly at just a 2 percent decline, thanks to the strongest third quarter since 2015.
Jewelry demand was also tepid in the U.S. The market reported its 11th consecutive quarter of declining demand, pushing annual jewelry purchases to a five-year low. However, rising prices pushed the value of U.S. jewelry demand to a record high of $10 billion.
Gold In Tech
Annual demand for gold in technology rose by 7 percent to 326.1 tonnes.
The use of gold in electronics increased by 9 percent to 270.6 tonnes, driven higher by a surge in demand for AI applications. There was also some recovery in the consumer electronics market after a weak 2023.
Global demand for gold in other industrial and decorative applications fell by 4 percent in Q4. This was chiefly driven by sagging demand in Italy and East Asia due to slow sales of branded accessories and de-stocking by retailers. On the plus side, Indian demand grew by 5 percent as high gold prices impacted the affordability of fine gold items and prompted greater demand for gold-plated articles and jewelry.
Mike Maharrey is a journalist and market analyst for MoneyMetals.com with over a decade of experience in precious metals. He holds a BS in accounting from the University of Kentucky and a BA in journalism from the University of South Florida.