


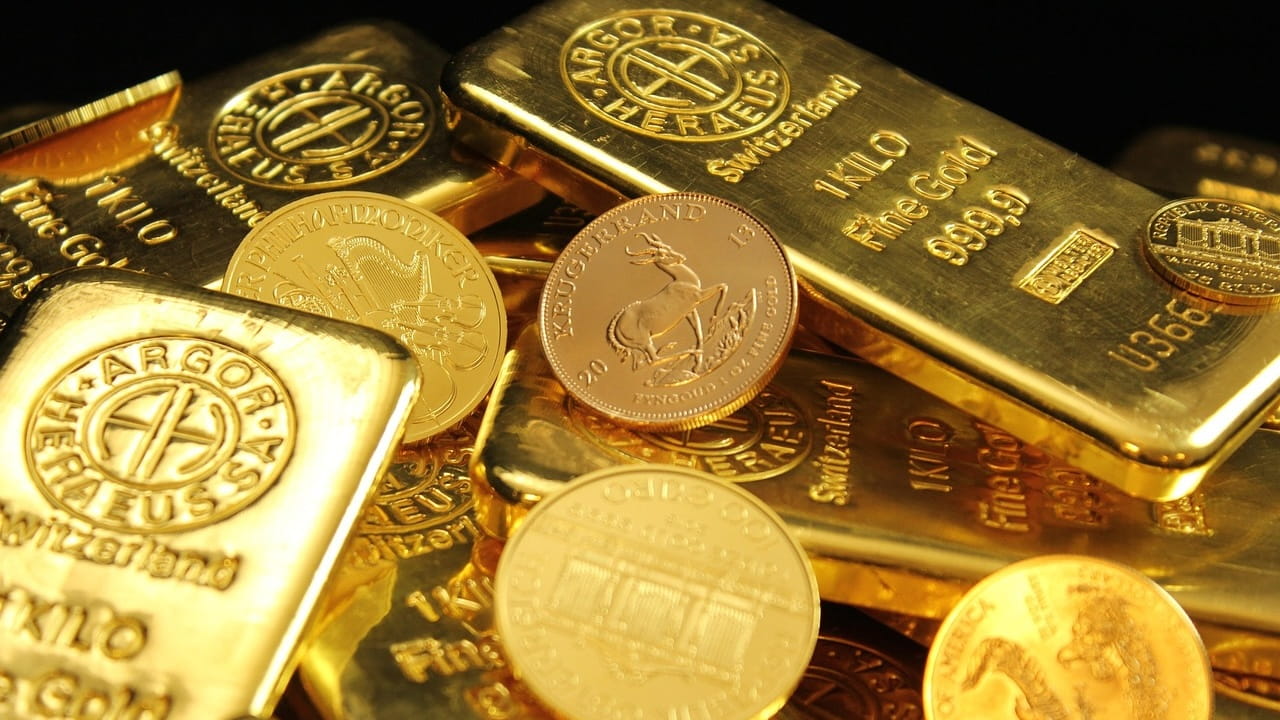
(Mike Maharrey, Money Metals News Service) Despite the steep correction and increased volatility, gold remains one of the best-performing assets over the last 12 months.
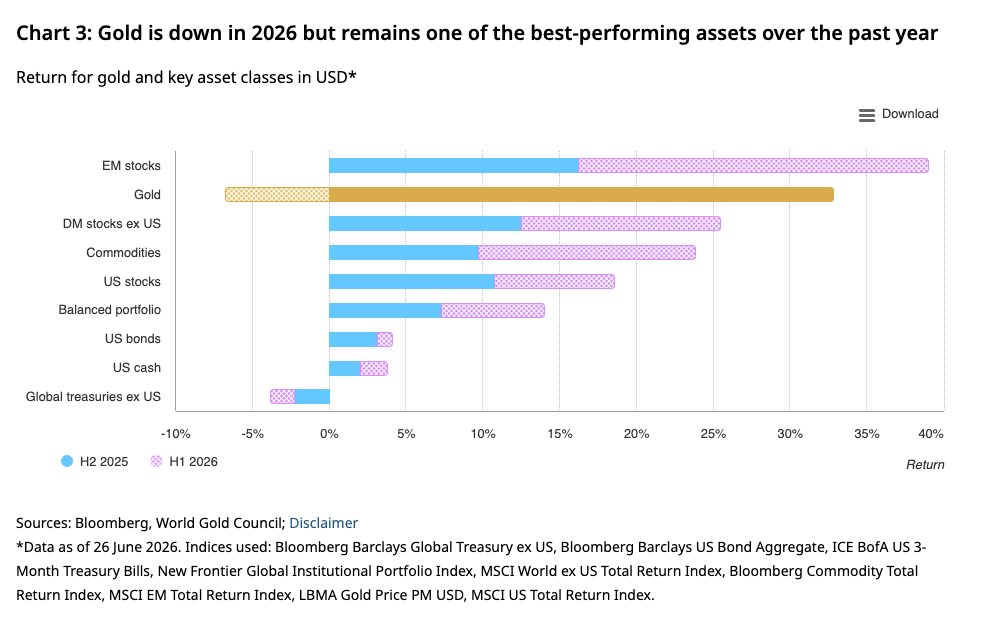
It feels like gold has tanked this year, but the yellow metal was only down about 7 percent through the first six months of 2026. The sharp price rally to kick off the year exacerbated the scope of the ensuing correction. Gold is down about 28 percent from its record highs.
Gold started the year with a bang, hitting 12 all-time highs and pushing above $5,000 an ounce in January. After a brief spike at the beginning of the U.S.-Iran conflict, gold has been generally range-bound between $4,000 and $4,500 an ounce.
Gold’s volatility spiked to over 50 percent early in the year. It has since moderated to around 30 percent; however, this is still far above the 20-year average of 17 percent.
Even with the correction, gold has still outperformed most assets over the last 12 months with a gain of around 33 percent. Only emerging market stocks have done better than gold in the last year.
The selloff has led some pundits to declare the gold bull market is over, but it’s important to remember that corrections are normal and healthy during a bull market, and the dynamics that drove gold to record highs remain firmly in place.
However, in the short-run, gold continues to face headwinds due to expectations that the Federal Reserve will maintain a tighter monetary policy to combat price inflation. However, mainstream prognosticators seem to be ignoring the massive Debt Black Hole and the difficulty it creates. A debt-riddled bubble economy does not function in a higher interest rate environment.
World Gold Council analysts say they think the current gold price is in line with the current economic backdrop of “moderate growth, cooling but still elevated inflation, and expectations of further – but limited – central bank tightening.”
“Under these conditions, gold will likely stay relatively rangebound (±5%).”
However, they say the “stage is set for a possible breakout.”
“On the upside, clear catalysts – a worsening economy or renewed geopolitical shock, a shift towards lower interest-rate expectations, or a wave of dip buying – could reignite gold’s momentum and lift it back towards US$4,500/oz or above. If the signals are strong, gold could push even higher. Conversely, an environment of resilient growth, rising yields, and calmer markets could see gold slip further – though a fall of more than 10 percent from current levels may be tempered by bargain-hunting demand. Meanwhile, enduring central bank demand and policy shifts in key markets like India are additional wildcards that could subtly influence gold’s path in the second half.”
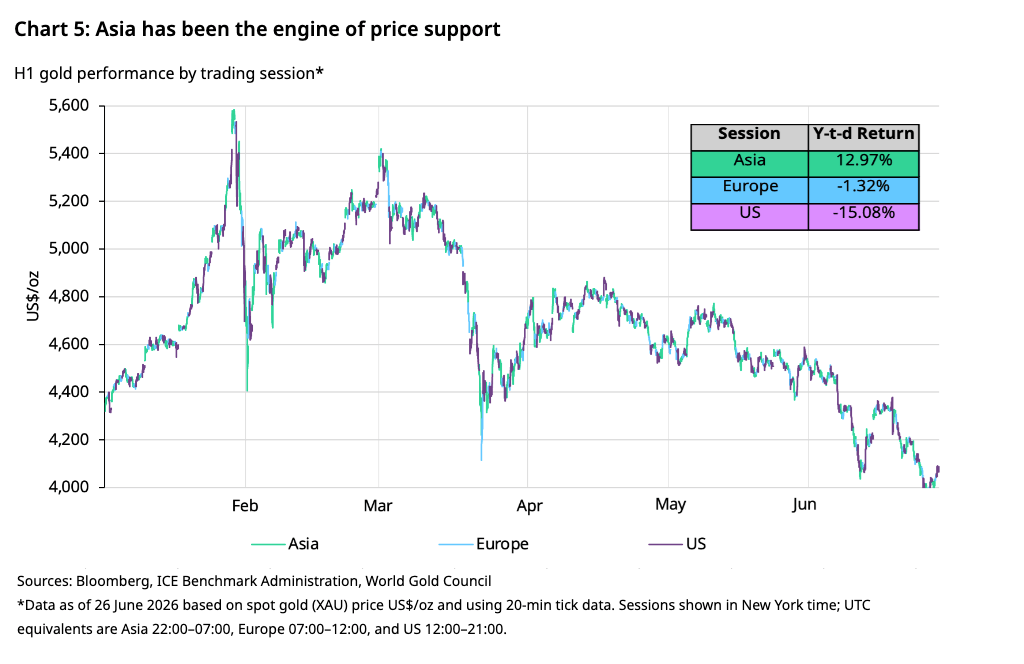
World Gold Council analysts picked up on an interesting trend through the first half of 2026. North American investors have driven the sell-off, with Asian investors taking advantage of price drops to add to their gold holdings. World Gold Council analysts call Asia “the engine of price support.”
“Interestingly, intraday analysis suggests that the bulk of gold’s movements have been linked to activity during Asian and U.S. trading hours. Many of the pullbacks occurred during US hours and, conversely, gold’s rebounds generally occurred during Asian hours.”
During Asian trading hours, gold was up 12.9 percent through the first six months of the year. During North American trading hours, the yellow metal was down 15 percent.
Mike Maharrey is a journalist and market analyst for Money Metals with over a decade of experience in precious metals. He holds a BS in accounting from the University of Kentucky and a BA in journalism from the University of South Florida.