


(Mike Maharrey, Money Metals News Service) There is evidence that underlying bond market dynamics have shifted toward a long-term bearish setup that will mean higher long-term interest rates despite central bank mechanizations. This has ramifications for an economy that is addicted to cheap, easy money and may alter traditional portfolio balancing.
A paper published by Massif Capital argues that over the last 20 years or so, interest rates were primarily driven by monetary policy expectations. Today, things are shifting, with long-term interest rates more dependent on geopolitical and fiscal risks. As a result, the bond market is being increasingly driven by investors seeking return instead of official-sector buyers such as central banks.
“The compensation component of the long yield, not the expected-path component (the average of expected future short rates over the life of the bond, essentially the path the market thinks the central bank will set policy along), is doing the work; the marginal price-setter has shifted from a price-insensitive official-sector buyer to a private, return-sensitive one; and the duration that used to absorb equity drawdowns now amplifies them when the shock is supply-side rather than demand-side. The implication is that the level of the long yield is no longer a clean read on policy expectations, and that lowering the policy rate cannot, by itself, restore either the term premium or the portfolio hedge.”
A Secular Bond Bear Market
For several years, economic analyst Jim Grant has forecast a secular bear market in bonds.
Grant laid out his view in a 2023 interview, saying he thought we were about to enter “a long cycle of rising interest rates” and a “generational” bear market in bonds. He bases his forecast on historical trends, noting that interest rates move through “generation-length phasing.” He frames his analytical process as “pattern recognition.”
“Interest rates fell for the last quarter of the 19th century, rose for the first 20 years of the 20th, fell from 1920, ‘46 rose in ‘46 to ‘81, fell from ‘81 to call it 2021. So, at each juncture, there was some mark of excess, some mark of speculative excess blow-off. Certainly, in 1981, you know, a 20 percent-plus funds rate seemed excessive. A 14 percent yield in 1984 in long bond when the CPI was printing at four or five that seemed excessive. 10 percentage points of real yield — that seemed a lot.”
In the 90s, things shifted, and we entered a long period of lower rates, capped off by nearly a decade of zero percent interest rates in the wake of the 2008 financial crisis. At the peak, there were nearly $18 trillion in debt securities “priced to yield less than nothing.”
“[It was] the most extraordinary expression of unqualified bullishness on an asset class because it had the name of ‘bonds’ which had been falling in yield, rising in price. So no, it would not surprise me at all if we were embarked on something resembling a generation-length bear market in bonds, meaning rising yields and falling prices that would fit the form.”
Changing Dynamics Support Bond Bears
Grant forecasts a long-term bear market in bonds based on historical patterns. Massif Capital analysts take it a step further and identify the changing dynamics in the U.S. Treasury market that could drive this long-term bearish trend into the future.
Keep in mind that yields are inversely correlated with bond prices. When demand for Treasuries drops, the price falls, and yields go up. Conversely, yields fall, and prices rise when demand picks up.
Over the last couple of years, there has been persistent upward pressure on long-term yields. The 10-year yield spiked in 2022, rising from around 1.5 percent in late 2021 to a high of nearly 5 percent in the fall of 2023. Since then, yields have remained at those elevated levels despite the Fed cutting rates and geopolitical events that would have historically created significant safe-haven demand for Treasuries.
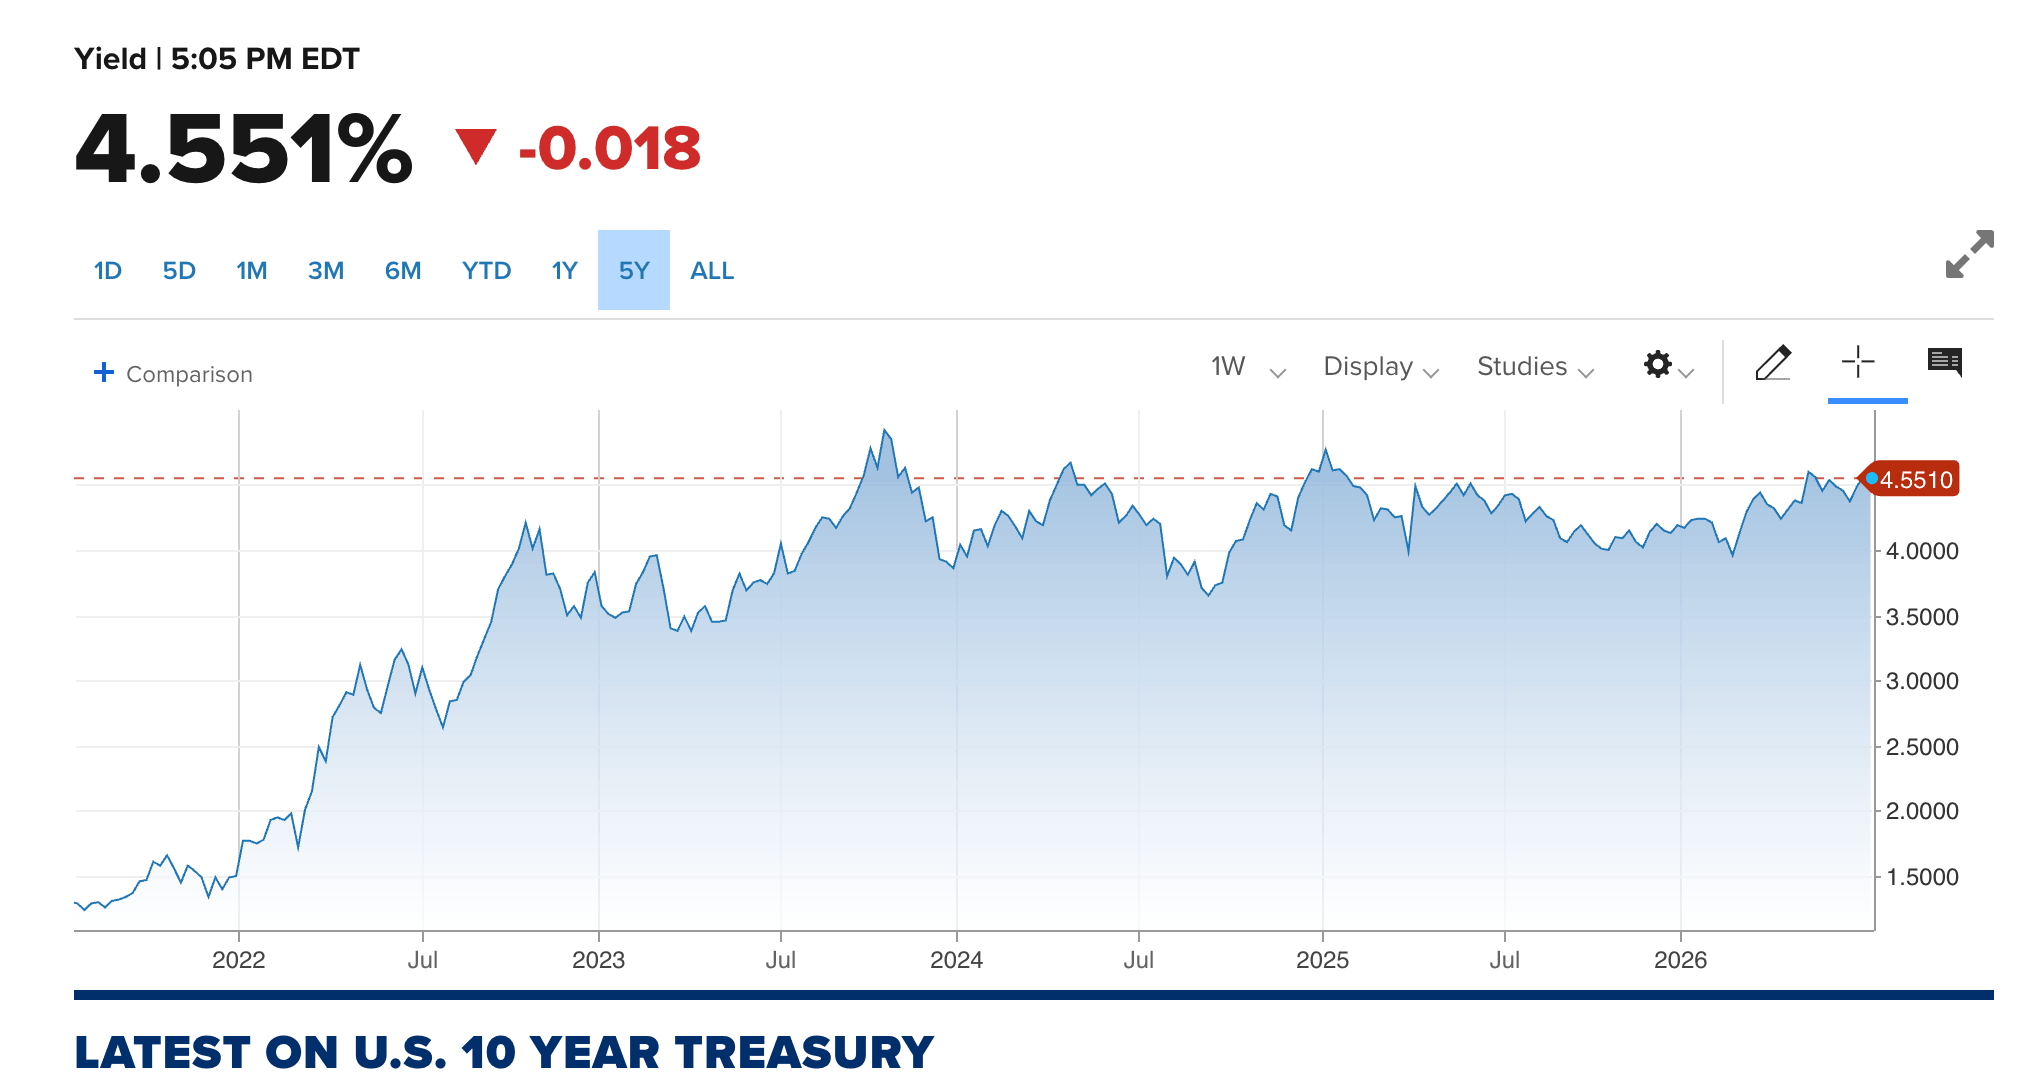
We like to imagine that the Federal Reserve controls the interest rate. However, it can only reliably move the short end of the curve. As Massif notes, rates went up on the long end of the curve even as the central bank began tightening policy to battle price inflation a couple of years ago.
“At its September 2024 meeting, the Federal Open Market Committee cut its target range for the federal funds rate by 50 points, marking the beginning of a new easing cycle. In the months after, the 10-year Treasury yield rose from 3.65 percent on September 17, 2024, to a recent peak of 4.79 percent on January 13, 2025.”
As Massif noted, an increase in long-term interest rates, such as the 10-year Treasury yield, is highly unusual at the beginning of a Fed easing cycle.
“The Fed cut, and the long end sold off. The expectations channel said yields should fall; the term-premium channel overwhelmed it. By the time of writing, with the March 2026 dot plot median implying roughly two 25-basis-point cuts between now and year-end, the ten-year sat near 4.45 percent, a modest move higher that reinforces an underlying assumption throughout this piece that central banks can lose tight control of rates and that the dot plot has stopped steering the long end. That is the regime change in one sentence.”
(Sign up for Massif Capital’s free email newsletter here.)
It is also telling that bonds have sold off during recent periods of geopolitical uncertainty, meaning they have lost their safe-haven status.
In fact, Treasuries have behaved more like a risk asset over the last couple of years. For instance, interest rates have tended to rise on negative news in the U.S.- Iran military conflict with Iran, indicating investors are selling bonds on bad news.
Massif noted that 10-year term premiums have reflected this selling with their upward trend.
“The New York Fed’s Adrian-Crump-Moench model put the ten-year term premium at roughly 0.6 percent in late May 2026, positive and rising, after a decade in which it spent most of its time trending down, and either negative or near zero. On January 13, 2025, the 10-year term premium reached its highest level since 2011, surpassing 0.8 percent. The higher term premium accounts for more than half of the recent rise in 10-year U.S. Treasury yields, suggesting investors associate greater risk and uncertainty with investing in longer-term debt.”
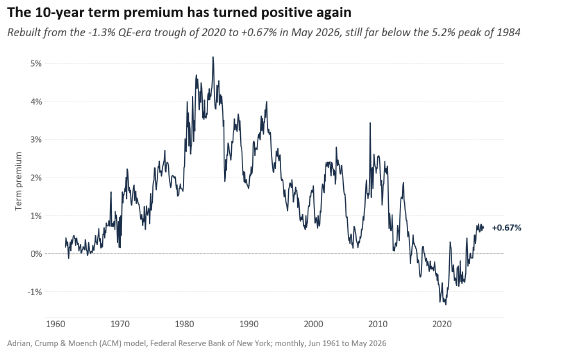
This reflects a fundamental shift in the Treasury market that would seem to confirm Grant’s belief that we are entering into a long-term bear market in bonds that will manifest in a period of higher average interest rates.
New Bond Buyers with New Priorities
The Massif paper argues that there has been a fundamental shift in the parties driving the Treasury market from official sector buyers who are relatively price insensitive, to private investors who are chasing yield.
For decades, governments and central banks have held U.S. government debt as a “safe” asset. That is starting to shift because many governments no longer view U.S. debt as “safe.” They are concerned about the U.S.’s fiscal position with constant deficit spending piling onto nearly $40 trillion in debt, along with the weaponization of the dollar. Notably, de-dollarization went into overdrive after the U.S. and its Western allies froze Russia’s dollar-denominated assets after the invasion of Ukraine.
Massif notes that many foreign government buyers have been slowly selling U.S. Treasuries over the last several years.
“Players like China are changing their approach and have been doing so for several years. China recently reduced its holdings to $652.3 billion, the lowest level since September 2008.”
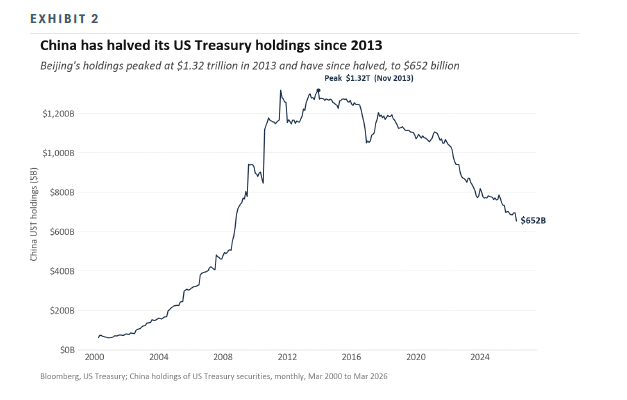
China isn’t the only country spurning U.S. Treasuries. Earlier this year, gold replaced U.S. Treasuries as the top global reserve asset.
This means private investors, who care a whole lot more about yield, are driving the Treasury market. This difference in investor priorities could shift the entire market into a new direction that will require lower prices and higher yields to maintain demand.
(Sign up for Massif Capital’s free email newsletter here.)
In effect, Massif argues that the compensation investors demand for holding long-term Treasuries. It’s no longer just about inflation and interest rate policy.
“What has structurally repriced is the compensation investors demand for holding duration risk, for holding one country’s paper rather than another’s, and forbearing the risk that the next macroeconomic shock is a supply shock rather than a demand shock, and that the dispersion this produces across sovereign curves and across the duration exposures embedded in areal-asset portfolio is now a larger and more persistent feature of the landscape than at any point since the early 1980s.”
The Inflation Machine
When price inflation spiked after the pandemic interventions, the Federal Reserve raised rates. It also began decreasing its balance sheet (quantitative tightening or QT). In practice, it began selling some of the Treasuries it bought during its quantitative easing (QE) operations. This increased the supply of bonds available in the open market, pushing yields higher.
Foreign investors hold about 30 percent of outstanding U.S. Treasuries. On top of that, the Fed has served as a significant source for Treasury demand. Massif paper notes that the Fed’s share of the Treasury market peaked at 23 percent in 2022 during pandemic-era QE. That means foreign investors and the Fed held more than half of all Treasuries issued.
However, the Fed’s holdings have also declined since the beginning of the tightening cycle.
“Foreign official accumulation, which absorbed a rising share of issuance through the 2000s and 2010s, has stalled and reversed for the largest buyers. The fiscal trajectory that the market tolerated at near-zero policy rates has become conspicuous at a 4 percent funds rate. Each of these is a withdrawal of demand or an expansion of supply at the long end, and each pushes the term premium in the same direction.”
However, late last year, the Fed pivoted back to QE.
Why?
Because the federal government is struggling under the weight of increasing borrowing costs. So far in fiscal 2026, the U.S. Treasury has spent $1.05 trillion on interest expense. That was up 14.23 percent compared to the same period in fiscal ’25. Interest on the national debt cost $1.2 trillion in fiscal 2025. That was up 7.3 percent over 2024.
Simply put, the federal government can’t afford higher interest rates.
If foreign governments aren’t interested in Treasuries, and private investors demand higher yields, the Fed stands as the only source of possible relief. The U.S. central bank can step in and buy Treasuries. It can fill the demand gap. It can drive rates lower. It can even engage in “yield curve control” by targeting Treasuries of a certain duration. For instance, it can buy 10-year Treasuries specifically and lower that yield.
However, QE requires money printing, and money printing means inflation.
This underscores the Catch-22 the Fed currently finds itself in. It must choose. It can tackle inflation and risk popping the debt bubble and toppling the economy, or it can try to keep the economy limping along by looser monetary policy.
It can’t do both.
A New Portfolio Approach
If we are moving into a secular bear market in bonds, it will likely require a change in the traditional portfolio approach.
Historically, the conventional wisdom on Wall Street was a 60/40 portfolio, with 60 percent of the holdings in equities and 40 percent in fixed-income investments, primarily bonds. The theory is that these asset classes balance each other, with stocks strengthening in a strong economy and bonds creating a hedge during downturns.
But as already noted, bonds are increasingly correlating with equities. In fact, both are behaving more like risk assets. Massif noted the changing relationship between these two asset classes and the ramifications of this change in market dynamics.
“The rolling correlation between U.S. equities and an aggregate bond index, moderately negative for most of the period from 2003 to 2021, spiked to +0.50, the highest in the sample, in 2022, and has averaged near +0.6 since. The correlation regime (based on interest rate expectations) depends on the source of the shock: demand shocks and flight-to-quality episodes produce negative correlation; monetary policy shocks and inflation surprises produce positive correlation. A geography-first regime (focused on the quality of debt) is, mechanically, a regime of supply shocks. When the dominant shock is a closed strait or an embargoed mineral, the duration ballast in a portfolio fails precisely when it is needed.”
This is why Morgan Stanley CIO Michael Wilson recently suggested a switch to a 60/20/20 strategy, swapping half of the bond portfolio for gold to serve as a “more resilient” inflation hedge.
As Massif notes, this is what central banks are doing in effect.
“The revealed preference of the official buyer is now gold: central banks have bought more than 1,000 tonnes annually for four years.”
Last year was the fourth-largest expansion of central bank gold reserves on record, at 863 tonnes. That was down 21 percent year-on-year, but still well above the 2010-2021 annual average of 473 tonnes.
The all-time high was set in 2022 (1,136 tonnes). It was the highest level of net purchases on record, dating back to 1950, including since the suspension of dollar convertibility into gold in 1971.
This is because, with bonds behaving more like risk assets, gold is the last haven standing. You can’t depend on bonds to hedge your portfolio. You need hard assets like gold.
Mike Maharrey is a journalist and market analyst for Money Metals with over a decade of experience in precious metals. He holds a BS in accounting from the University of Kentucky and a BA in journalism from the University of South Florida.